Vocal tract modeling in any form depends heavily on information about the shape of the tract from the glottis to the lips. Regardless of whether or not the position of the tongue and the opening of the nasal cavity are taken into consideration, all models are based (at least partially) on what is called the area function. An area function is a function of the cross sectional area of a cylindrical element in relation to the distance from the glottis. Because we can assume one-dimensional wave propagation, the “tubular vocal tract shape can be approximated as a finite number of cylindrical elements that are ‘stacked’ consecutively from the larynx to the mouth.” (Story and Titze 1996)

Area function data, as well as other information about the vocal tract and speech productions as a whole, has been illuminated thanks to the evolution of magnetic resonance imaging or MRI. Magnetic resonance imaging can generate detailed images of practically any part of the human body simply by utilizing the body’s natural magnetic properties. Basically, being placed in an MRI introduces the body to a strong magnetic field causing all of the body’s hydrogen atoms’ protons’ axes to align. Additional energy in the form of a radio wave is added causing the magnetic vector created by the aligned protons to be deflected. When this radio source is stopped the magnetic vector returns to its previous state and emits the signal used to produce an image.

Prior to the success of MRI, x-ray was often used to view the vocal tract. MRIs provide a safer and more comfortable experience for the subject as well as more accurate imaging, in some regards, for the scientists. An x-ray video of this nature can be seen here: https://www.youtube.com/watch?v=KzZm5ZawA3M&list=PLmfAb9VxFD3VyDYZzl2SsApA_LlOL-tjV&index=3
In the mid-1990s a group of American scientists used MRI technology to calculate a variety of area functions by scanning a male subject while he pronounced 12 vowels, 3 nasals, and 3 plosives. Their accuracy was tested by comparing the format locations of natural recorded speech by the same subject to the newly calculated area functions, as well as to four previous studies. The comparison showed definite similarities between the two, with the exception that the MRI imaged vocal tract shapes appeared more centralized.
MRI technology has also been used in the past several years to generate solid 3D parametric models of the vocal tract itself. It is considered an improvement over the radiographic studies performed in the years prior because of the potential health hazards associated with the radiation required by these old techniques. The MRI images were used in conjunction with the computer software Solid Edge to generate a 3D model.
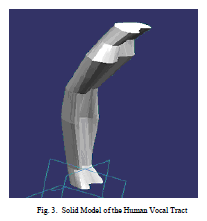
The benefit of this technique is it would allow for models of different conditions through geometric parameterization. The accuracy of this technique was established by comparing the cross sectional areas from the MRI to those from a pharyngometer. A pharyngometer, similar to a rhinometer, is a device often used in the study of sleeping disorders, ENT, and orthodontics.

It uses acoustic reflection technology to map the oral and nasal airways, which is then used to generate another model. The benefit of this technique is that it requires a very limited amount of information about the vocal tract being modeled. In a similar way, I have used area function data previously gathered via this MRI technique, to create a 3D computer model as the basis for the production of my physical models. Diagrams of my physical models can be viewed by clicking on Technical Drawings to the left.