Jade is the program that lets you manipulate powder diffraction data, including finding peaks, calculating d-spacings, exporting data, and even matching peaks to particular powder diffraction file patterns using the PDF peak search and match database. This page covers only basic things: reading diffraction files, modeling the background, Kα2 peak stripping, and peak finding.
Open the Jade program by double-clicking on the MDI Jade icon on the desktop (also available in the Start/file list menu). By the way, MDI stands for Materials Data [something or other]. Here’s the web site. If you find out what the ‘I’ means, let me know.
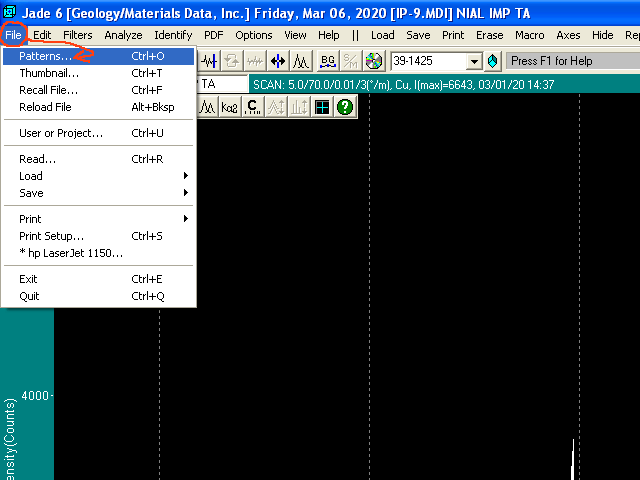
To load your new or old pattern, select the File/Patterns menu item.
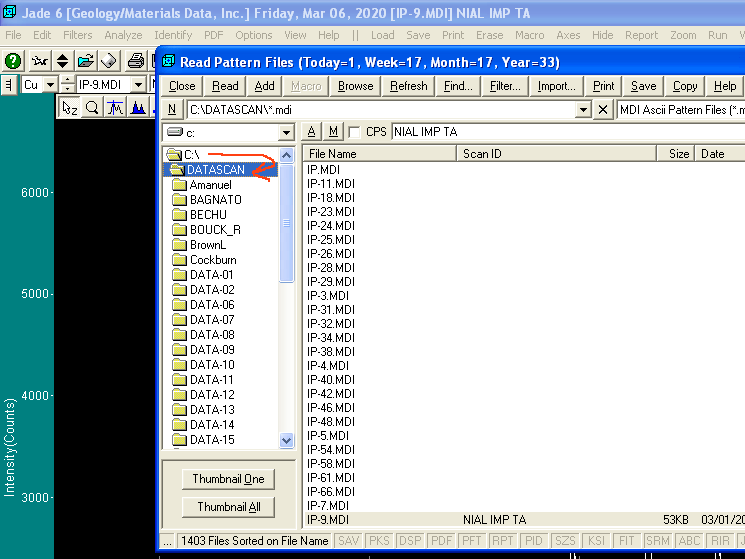
The Datascan data files are located in the C:\DATASCAN folder. There are many subfolders, so use the one for your project. Remember this is very old software, so file names are restricted to 8 characters.
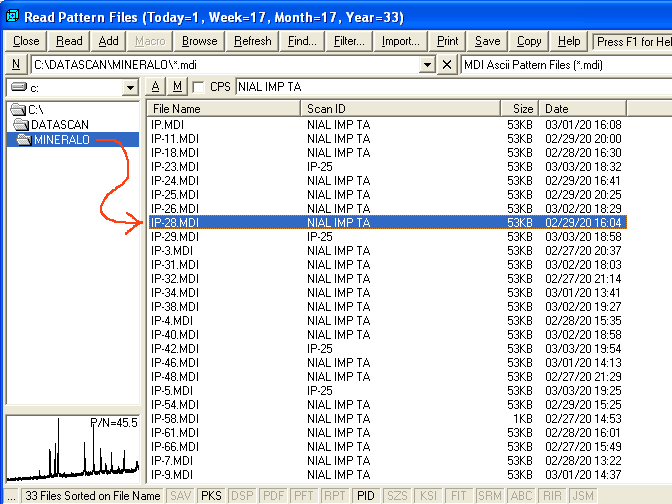
Navigate to your folder and select your file. Double-click on it to read it in. If your file doesn’t seem to be there, and the data were collected recently, press the Refresh button. If it’s an older file, it was probably saved somewhere else and you’ll have to search for it.
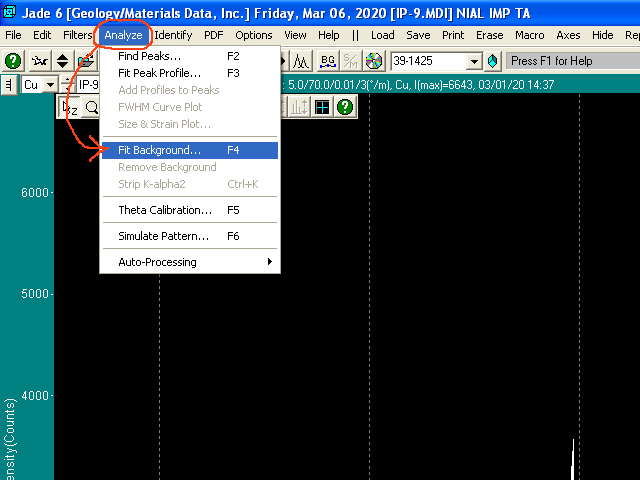
Your XRD powder pattern should be open now. Select Analyze/Fit Background from the menu.
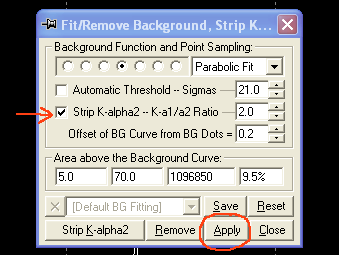
You are presented with this busy window. The upper part has statistical variables for the background fit. You can play with them until you get a fit you like, which shows up as a yellow curved line across the background signal at the base of the peaks. Make sure the Strip K-alpha2 box is checked.
The middle part gives you the results of the background fit, basically the area of peaks above the background between the start and stop 2Θ angles, and % of the area above the background curve. In general, if the background curve looks good, it’s probably good enough.
Press the Apply button.

Next press the Strip K-alpha2 button in the same window. There are other ways to handle the Kα2 peaks, but this cleans-up the displayed pattern and makes it easier to interpret.
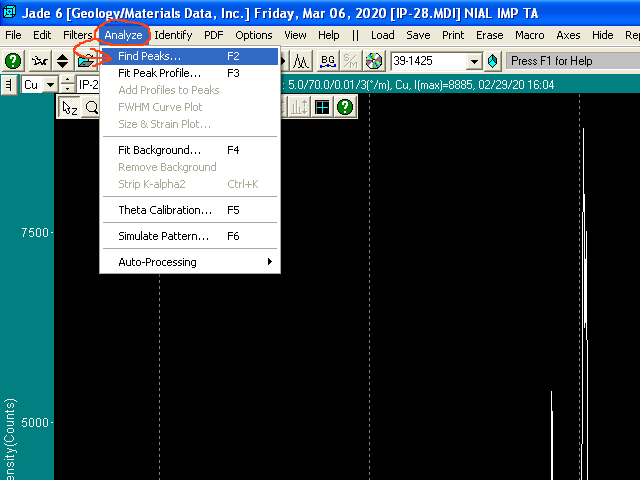
Select Analyze/Find Peaks from the menu.
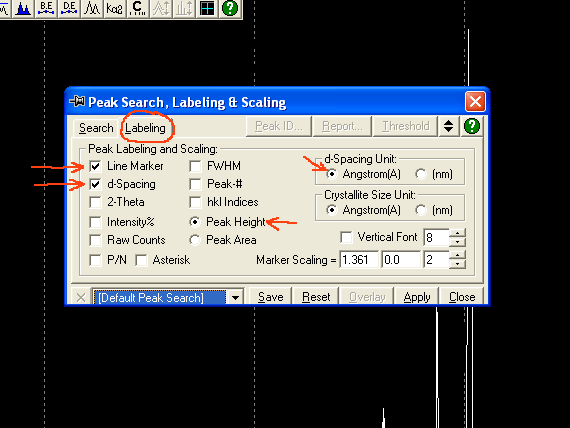
In the Peak Search window, select the Labeling tab. Each peak can be labeled with all sorts of things. However, more than one or two items makes such a mess that the labels are hard to read. In general, select the Line Marker and d-Spacing.
Also make sure the pattern is evaluated for Peak Height (unless you specifically want area), and make sure the d-Spacing Unit is in Ångstroms (unless you want nanometers).

Select the Search tab. This is mostly statistical and other variables used to control peak searching. In a practical sense, you want the search routine to find real peaks, and ignore noise. Changing Threshold Sigmas and Intensity Cutoff(%) are the best ways to do that. Make changes, and then press the Apply button to see how changes affect which peaks are found. You can do this repeatedly, so feel free to play with the numbers until you get what you want.
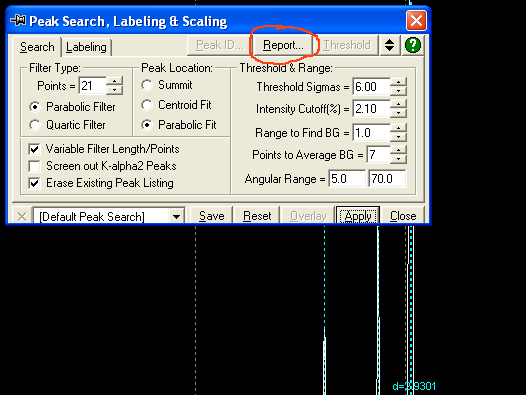
When you have what look like a nicely matched set of peaks, press the Report button.
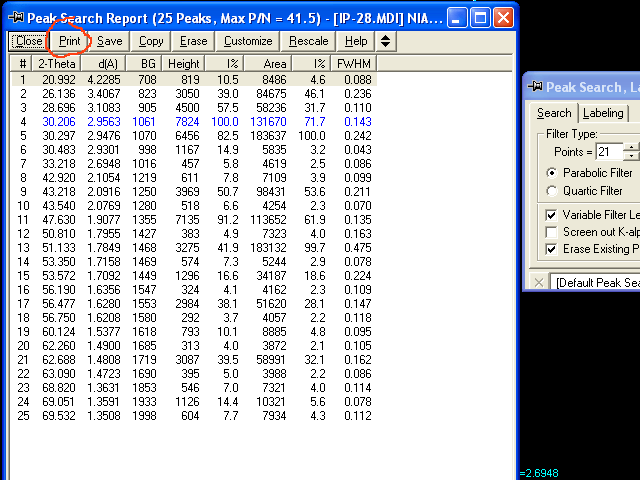
The peak search results are shown in a table format. 2Θ position and d-spacing are the first two columns. The other columns are interpolated background height, peak height, intensity based on peak height, peak area, intensity based on peak area, and peak width at half maximum.
Press the Print button to print the table. It can also be saved in several digital formats, for bringing the results into a spreadsheet, for example.
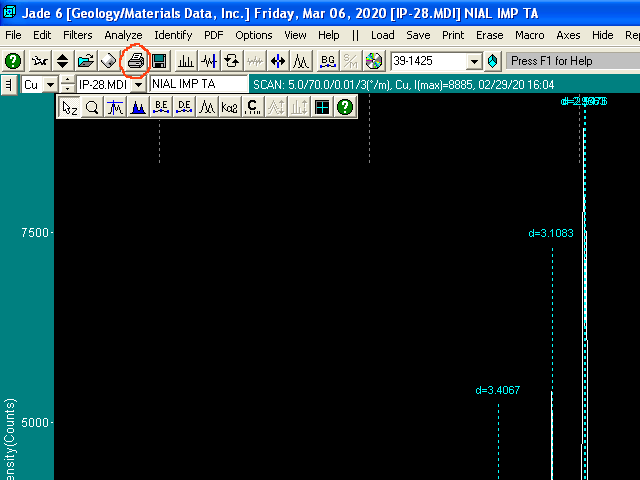
You can print the XRD pattern, with labeled peaks, by pressing the printer icon. It’s also possible to save the raw or modified pattern data in a number of different digital formats, for importing into a spreadsheet, for example.
This computer also has access to the ICDD-JCPDS powder diffraction file database. Click the CD icon to open the pattern matching program (it’s a separate program from Jade).
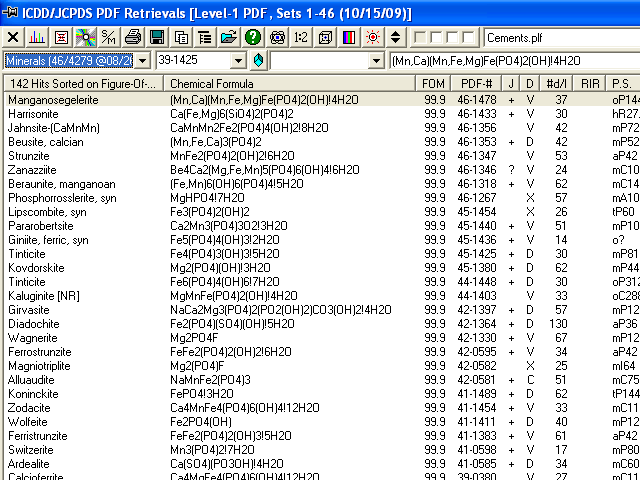
The search and match program is quite complicated, and the help file is not that helpful. However, the idea is to set up database subsets of not more than 500 minerals (a software license restriction), and to search in those subsets. Some subsets have been made already, Cements.plf is the one displayed here. You can compile lists by chemical elements, chemical formulae, crystal structure, and other ways. The learning curve is steep, but if you work through it, it can be a real time saver.
And another thing, clicking on any record in the displayed table shows those peak positions as yellow lines in the Jade pattern window. It’s a quick way to visually scroll through a lot of possible matching phases.