Global Perspective

For my final blog post of the term, I will focus on Global Perspective. A global perspective is a viewpoint that attempts to understand the place of individuals, groups, cultures, and societies in the world and how they relate to each other. An example of a global perspective is studying the implications of economic policies on illegal drug use specifically the supply chain, where the drug is produced, and the local area where the drug is sold.
The link below provides information on the global perspective of climate change. In terms of the math part of this, According to The Fourth Assessment Report (AR4) of the Intergovernmental Panel on Climate Change, the atmospheric concentration of CO2 has increased from 280 ppm in the period 1000–1750 AD to 379 ppm in the year 2005. The concentration of methane in the atmosphere has more than doubled from 700 ppb in the period 1000–1750 AD, to reach a concentration of 1774 ppb in the year 2005. The concentrations of hydrofluorocarbons, perfluorocarbons, SF6, and N2O have also increased. The tropospheric concentration of ozone has increased even though its stratospheric concentration has decreased.


https://link.springer.com/chapter/10.1007/978-1-4020-5774-8_1#:~:text=The%20global%20mean%20surface%20temperature,warmed%20faster%20than%20the%20oceans.


global perspective


CO2 Emissions Per Capita Per State

The graph I created is one that shows the annual CO2 emissions per capita per U.S. State with data up until 2017.

(I couldn’t get the chart to upload with better quality for some reason, so please use this link instead to view it as a PDF)

In metric tonnes, this data helps to show the amount of CO2 emissions produced per state per person. When looking at this graph, it is very easy to see where the high amounts of CO2 emissions per capita are found: states like Wyoming, North Dakota, and Alaska stand out as the worst offenders for CO2 emissions per capita. This is in contrast to states like New York, California, Oregon, and Maryland who comparatively have very small CO2 emissions per capita.

This could lead people to believe that states like Wyoming, North Dakota, Alaska, etc. are more responsible for the large CO2 emissions put out annually by the U.S. as opposed to states like New York, California, etc., but that would be incorrect. What this chart tells us instead is that states on this chart that appear to be putting out gargantuan amounts of CO2 are instead putting out large amounts of CO2 in comparison to their population. A state like Wyoming that has a relatively small population but large amounts of farming/agriculture could appear to produce extreme amounts of CO2 compared to a state like New York, when in reality New York could be putting out much more CO2, but due to its large population it doesn’t appear to be as extreme of a CO2 emitter as Wyoming.


WORKS CITED

https://www.eia.gov/environment/emissions/state/analysis/

Single Use Plastic Bottles per Week

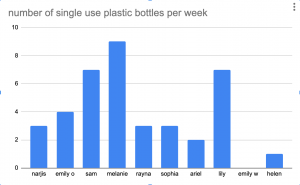
Single use plastic water bottles are very bad for the environment, typically because they are not recycled and are often thrown out. The plastic takes centuries to full decay and as plastic decays it leaks dangerous chemicals into the groundwater and soil. Even if plastic is recycled, it might not be recycled properly and would still need to decay on the earth. The total carbon footprint of one plastic water bottle is about 828 grams of carbon dioxide. Lots of college students use single use plastic bottles for water, coffee or any other drink. These cups are typically thrown away, adding to the amount of plastic waste in the world. This chart shows that the average number of single use plastic bottles per week is 3.9 amongst the sample size that I gathered data from. The lowest number per week was 0, due to my friend’s constant usage of a reusable water bottle and the highest number was 9. That means per week a college aged student similar to my friends would use 3.9 single use bottles adding up to a 3229.2 grams of carbon dioxide per week released due to this plastic waste.

sources: https://www.greenamerica.org/blog/truth-about-bottled-water


Construction’s Relation to Sustainability

More often than ever, as a nation, we are witnessing forests and woodlands being torn down. The most common reason for tearing down all of these trees is to start up a new construction cites. Although there are a surplus of different reasons that these trees and animals habitats are being torn down, it eventually all comes down to greed. Most of the buildings that are being constructed are money-making entities. Consider some of the following examples; apartment buildings, storage facilities, casinos, etc. In fact, the amount of trees that are being planted opposed to torn down is an incredibly interesting ratio.

Annually, 15 billion trees are cut down. On the other hand, only 1.9 billion trees are planted a year. That means that the ratio of trees that are cut down to planted is 15 to 1.9. Meaning, for every 1.9 trees that are planted, 15 trees are torn down. To help better understand this idea, “For the 15 billion trees that are chopped down each year, every person on the planet could have 3,000 rolls of toilet paper” (Kilgore, 2022). According to Jonah Bader, “President Joe Biden has announced an ambitious goal of net-zero emissions by 2050… The idea of “net-zero emissions” is that any remaining emissions can be fully offset by so-called “negative emissions” — methods of sucking carbon out of the atmosphere. Planting trees is the most straightforward way to do that. Trees absorb CO2 for photosynthesis and store it as cellulose and lignin, the main components of wood” (Bader, 2021). Furthermore, “Planting trees may also be the most popular climate policy. Even former President Donald Trump loved the idea. He championed an international initiative to plant 1 trillion trees, which would be enough to soak up at least a decade of global emissions” (Bader, 2021). The possibilities are endless when it comes to further studying the ways that construction cites interfere with sustainability.

Works Cited:

https://www.cnn.com/2021/02/10/opinions/climate-plant-and-cut-trees-down-bader/index.html

https://www.gotreequotes.com/how-many-trees-are-planted-each-year-month-day-minute-second/

How Many Trees Cut Down Each Year or in 2022? The Deforestation Crisis Explained

Sustainable Carbon Emissions

Carbon Dioxide emissions are crucial to address when concerning climate change and global warming. Industrial Revolutions have been occurring for about 200 years and are still happening in countries today. Carbon emissions contribute to the overall heating of the Earth, the IPCC has made goals to try to limit heating to 1.5 degrees Celsius over the pre-industrial level. If our emissions continue on the trend they’re on we will pass by the 1.5-degree mark quickly. According to the Mauna Loa Record Keeling Curve in 1960 the carbon concentration levels were at about 315ppm fast forward to 2020 where it reached about 415ppm. That’s an overall change of 100ppm, 32% increase, growth factor of 1.32, and an average rate of change of 1.67ppm/yr. It’s difficult to enforce and make policies to ensure fair and equal emission standards. There’s a lot of debate over levels and who should be held responsible for the emissions and countries have to be able to industrialize as well. But there is a lot of promise in the renewable energy field. Many innovations, jobs, and decreased use of carbon would result in helping decrease the concentration levels from contributing to the warming of the Earth.

https://scrippsco2.ucsd.edu/graphics_gallery/mauna_loa_record/mauna_loa_record.html

Oceans and Marine Systems

Oceans cover the largest portion of Earth’s surface (71% of Earth’s surface is water and oceans makeup 96% of Earth’s water supply). It’s extremely important to consider and be concerned about our oceans and what climate change and human activity is inflicting upon them. Sea-level rise, ocean acidification, overfishing, pollution, ecological collapse, dead zones, and more. Within each of these larger problems are more sub-problems. Sea-level rise and polar ice caps melting, ocean acidification and the bio-pump, overfishing and bycatch, and pollution and micro plastics (the Pacific Garbage Patch is currently 1.6 million square kilometers). Humanity relies heavily on oceanic processes and marine resources, if more sustainable practices were used and enforced the ocean (and the global environment) wouldn’t be in such a compromised position. The ocean also acts as a HUGE carbon sink so not only do human lives revolve around the ocean in the literal resource sense but it is also taking in so much of the carbon humanity produces. The ocean can’t take in carbon forever, the effects of this are already been seen in phytoplankton and zooplankton, the ocean is becoming warmer and nutrient deficient which will have cascading effects on marine food chains.

The Effects of Carbon Dioxide Emissions on POC’S

Communities of color are extremely effected by the burning of fossil fuel. it is reported that People of color breathe “in 40% more polluted air than white communities across the US. ” Fossil fuels are viewed as the main cause of this. The effects of the extreme amount of Carbon Dioxide emissions are extreme. Some of the effects include high blood pressure, coma, asphyxia, convulsions, etc. In fact in the US POC’s are 38% more likely to be exposed to asthma. Something that surprised me while researching for this blog post is that, even though Black people make up 13% of the US population 68% live within 30 miles of coal plants compared to 56% of white people. Coal plants are places where coal is burned in order to make electricity, bought throughout his process they are releasing. a large amount of fossil fuels into the atmosphere. Now don’t get me wrong these are both huge numbers and we really should be asking ourselves why are their so many coal plants to begin with, but we should also be asking ourselves why is it that people of color are significantly more effected by this than white people? and why are POC communities specifically where they want to be building coal plants, what makes that environment the best fit? In 2020 alone the US has emitted 4.58 billions metric tons of carbon dioxide now let’s imagine how the POC community was effected by this. Fossil fuels come from everywhere 29% is burned through transportation, 25% through electricity, 23% through industry, etc. These are things that we we use/interact with in our daily lives. We need to be able to be made aware of because the rise of CO2 emissions effect the environment we live in, in different ways. Although Carbon Dioxide is the fourth most abundant gas in our atmosphere it is still something that we need to watch the levels for!

Work Cited:

Fernandez Rysavy, Tracy, and Andre Floyd. “Green America.” Www.greenamerica.org, www.greenamerica.org/climate-justice-all/people-color-are-front-lines-climate-crisis.

United States Environmental Protection Agency. “Global Greenhouse Gas Emissions Data.” US EPA, 9 Apr. 2018, www.epa.gov/ghgemissions/global-greenhouse-gas-emissions-data.

Wisconsin Department of Health Services. “Carbon Dioxide.” Wisconsin Department of Health Services, 2 Jan. 2018, www.dhs.wisconsin.gov/chemical/carbondioxide.htm#:~:text=Exposure%20to%20CO2%20can%20produce.


How humans most contribute to carbon dioxide emissions

Carbon dioxide is an important greenhouse gas and since the industrial revolution, has been rising in levels in our atmosphere contributing to global warming and climate change.  According to the EPA, as of 2019, carbon dioxide accounts for 80% of greenhouse gas emissions that stem from human activities.  Knowing this, it means that, to reduce these emissions and mitigate global warming, we must be conscious of which activities we do that contribute to carbon dioxide emissions in our atmosphere the most.  Combustion of fossil fuels is by far the human activity most responsible for greenhouse gas emissions; from transportation to energy use, fossil fuels are used often by human beings and are therefore responsible for the majority of carbon dioxide emissions.  Transportation, in 2019, was responsible for 35% of carbon dioxide emissions; as fossil fuels such as diesel and gasoline are combusted to act as fuel for transportation, they contributed the most to carbon dioxide emissions.  From cars to planes to trains, most forms of transportation rely on the combustion of fossil fuels and are the greatest way in which humans contribute to carbon dioxide emissions.  The second and third most important ways in which humans contribute to the aforementioned emissions are through electricity, which is responsible for 31% of emissions, followed by industry at 16%, both also due to the use of fossil fuels for energy.   By adding carbon dioxide to the atmosphere through these processes, humans have contributed to an increase in the greenhouse gasses in the atmosphere.  While this is an issue as it is a main contributor of climate change, to help address this issue, we first need to become aware of what human processes have contributed the most to the addition of carbon dioxide to the atmosphere so we can figure out solutions and alternatives to the burning of fossil fuels.  From this data, we can see that focusing on energy efficiency will be the best solution in regards to mitigating our contributions of carbon dioxide to the atmosphere.


https://www.epa.gov/ghgemissions/overview-greenhouse-gases#carbon-dioxide

Rising Co2 levels impact on human health

When researching rising levels of CO2, it’s easy to find topics such as climate change and how that may affect the environment as we know it.  However, what’s not talked about throughout the media often is the affect the rise of Carbon dioxide has on human health.  In fact,  CO2 levels of 1,000ppm have been found common in small confined spaces, such as classrooms, offices, bedrooms, and planes.  Now this may not seem that important, but carbon dioxide levels over 1,000ppm can cause inflammation as well as reduced cognitive function, and those levels are not that hard to pass within the confined spaces that I mentioned.  Chronic Exposure  levels from 2,000ppm to 3,oooppm can cause even worse damage such as kidney calcification and bone demineralization.  When thinking about the environment, and how climate change is impacting the world, that also causes quite the dilemma when it comes to human health as well.  Air pollution kills 9 million people every year, and as the temperature rises, the problem only gets worse.  In a 2008 study, rising levels of CO2 can cause the temperature to go up by 1 degree celsius, causing ozone damage which can kill 22,000 people due to asthma or some sort of respiratory illness.

I think human health is very important to note since there are still quite a lot of people who do not believe in climate change still to this day.  Possibly bringing up the fact that CO2 levels rising can directly affect one’s health may shine a light on the subject, since the affect on the environment may not be enough.  It’s very evident to see that within the media there’s been a rise in hurricanes and fires, and ticks have been increasingly apparent due to climate change.  Although these are little things at the moment, it’s only a matter of years before there’s irreversible damage to the planet as well as people’s lives.  Hopefully with more outlets supporting the negative impact climate change has on human health, more people can be aware and acknowledge the dangers.


work cited:

https://www.businessinsider.com/how-atmospheric-carbon-dioxide-affects-health-2018-5

https://www.niehs.nih.gov/research/programs/climatechange/health_impacts/index.cfm

https://www.frontiersin.org/articles/10.3389/fpubh.2020.543322/full