Below in Figure 1 is a graph with three-phase sinusoidal waves.

Each of the three sinusoidal waves are compared to each other to determine the pulse width modulation of each MOSFET. Below in Figure 2 is the inverter circuit with the MOSFETs numbered.

When the 0-degree phase shifted sinusoidal wave is the maximum, MOSFET 1 is high. When it is the minimum, MOSFET 4 is high.
When the 120-degree phase shifted sinusoidal wave is the maximum, MOSFET 3 is high. When it is the minimum, MOSFET 6 is high.
When the 240-degree phase shifted sinusoidal wave is the maximum, MOSFET 5 is high. When it is the minimum, MOSFET 2 is high.
Below in Figure 3 is the Simulink model of the rectifier circuit.

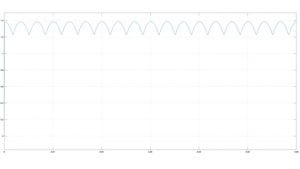
Below in Figure 4 is the output of the Simulink rectifier.

Click here for the MATLAB code.