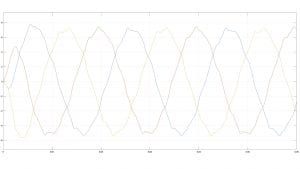
Below in Figure 1 is a graph with a triangle wave and three-phase sinusoidal waves.

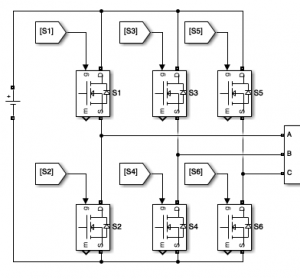
Each of the three sinusoidal waves are compared to the triangle wave to determine the pulse width modulation of each set of MOSFETs. This is a technique called Sinusoidal Pulse Width Modulation (SPWM). Below in Figure 2 is the inverter circuit with the MOSFETs numbered.

The MOSFETs are paired in the vertical direction. Below in Figure 3 is the PWM graph for the 0-degree phase shifted sinusoidal wave.

When the sinusoidal wave is greater than the triangle wave, MOSFET 1 of the first pair is high while MOSFET 2 is low. When the sinusoidal wave is less than the triangle wave, MOSFET 1 is low while MOSFET 2 is high. Below in Figure 4 is the PWM graph for the 120-degree phase shifted sinusoidal wave.

When the sinusoidal wave is greater than the triangle wave, MOSFET 3 of the second pair is high while MOSFET 4 is low. When the sinusoidal wave is less than the triangle wave, MOSFET 3 is low while MOSFET 4 is high. Below in Figure 5 is the PWM graph for the 240-degree phase shifted sinusoidal wave.

When the sinusoidal wave is greater than the triangle wave, MOSFET 5 of the third pair is high while MOSFET 6 is low. When the sinusoidal wave is less than the triangle wave, MOSFET 5 is low while MOSFET 6 is high.
In order to use Arduino’s PWM, the ON and OFF delays of each MOSFET need to be calculated based on the PWM graphs. This will be done in MATLAB.
Below in Figure 6 is the Simulink model of the inverter circuit that creates the same PWM graphs.

Below in Figure 7 is the output of the Simulink inverter.

Click here for the MATLAB code.