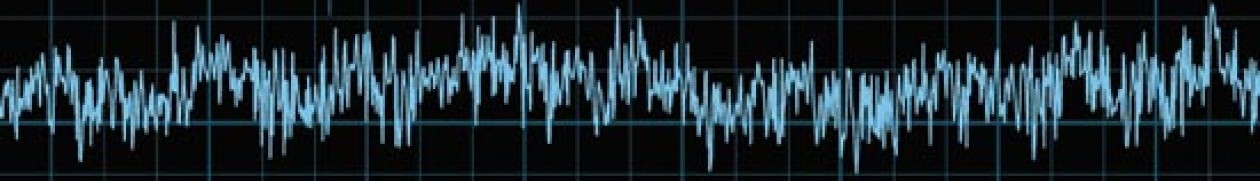
During this weekly meeting, I brought my MATLAB plots of data captured from the power systems lab. I successfully edited the python script so that the measured frequency and voltage magnitude signals were saved as text files. I also was able to upload these files in MATLAB and plot the data over the measured time period. When showing my results to professor Dosiek we realized that the number of samples captured was not accurate for the amount of time that I measured data. I measured data for 2 hours and with a sampling rate of 60 samples per second there should have been over 400000 samples but my text files contained much less. Professor Dosiek also mentioned that I would need to apply a lowpass filter to the measured data with a cutoff at 2 Hz. After discussion with a friend that is a computer science student, I discovered that the sample capture is not accurate if I run the python script in the python command window instead of the raspberry pi command terminal. When running the script in the python command window, the Bitscope device has an inconsistent sampling rate with pauses in between each measurement. The meeting ended with Professor Dosiek asking me developing pseudo code for converting the measured data into MIDI parameters.