Global Awareness; An Around the World View

For the last blog of the year, I wanted to focus on something very broad that covers much of the worlds views and understanding of climate change. This is no easy task to quantify. Obviously, the worlds more advanced and industrialized countries will have a higher understanding of the dangers of climate change while the populations of third world countries are proven to likely be more concerned with locating the day to day necessities of life rather than showing concern for what their grandchildren’s future may look like.

This chart here shows a list of surveyed countries and where they rank on how large of a threat they see climate change to be. After viewing this, it is pretty embarrassing that roughly 40% of the Americans don’t see climate change as a serious threat but that they are more concerned with ISIS and cyber attacks – this is a serious lack of intellect. However, over a 5 year span from 2013-2018, every country on this list had an increasing concern in regards to climate change, which I guess is a good sign when it comes to awareness. A quick political digression, but in the US, in 2018, 27% of republicans viewed climate change as a real threat while 83% of democrats viewed it as a threat. This is in direct result of former President Trump and makes Americans look dumb compared to the other world powers.

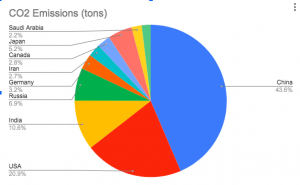
CO2 Emissions by Country

Of course we know now that emissions of carbon dioxide are incredibly harmful to our earth and the ozone. As one of the most prominent and dangerous green house gasses, limiting carbon dioxide emissions is crucial to saving our planet before it heats up to a point of no return. The graph that I am going to conduct is relatively simple but it will be stats on some of the largest and most industrialized countries in the world and the numbers that relate to their C02 emissions.


These ten countries make up nearly 70% of the worlds CO2 emissions and of these 10 countries, China make sup 43.6% of the emissions. These countries are all very industrialized and have shown large jumps in population growth. If that growth continues, some policies have to implemented to lower these emissions!

Race Wealth Gap and Gentrification

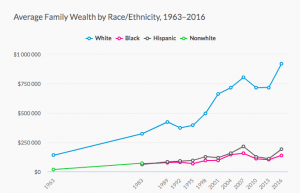
For this blag post I wanted to focus on something that I have previous knowledge about and that is in part to my Political Science background as a Union College student. Much of the focused in my classes has been on race segregation as well as housing political segregation among races. Gentrification, which is the forceful removal of residents out of their homes in Urban area is what I will discuss in this blog. Much of gentrification is based upon the the wage gap of race in the United States. Here is a graph depicting the wage gap between Black and White Americans..

.

As you can see very clearly by this line chart, there is quite the disparity between the average wages between black and white families. Coinciding with this wage gap, is the demographic of people who live in inner city areas which is where gentrification is most prominent. It is on average that 30% of inner city populations is made up of Black citizens. While this is less than the white community, the population of African Americans in the United States is only 13%. Of black people, there is a greater percentage living in inner city, gentrified areas than there is the percentage of white people. Everything in the US’s economy works around the capitalist society that our country was built upon. African Americans make less money on average and are faced with more severe challenges in urban areas than the white urban population is facing.


Electric Vehicles; a deeper look!

The man that we all know, who just recently bought Twitter, Elon Musk, has paved a positive progression of sustainable growth with the success Tesla has found and its push for others to drive sustainable with electric vehicles. There is a lot more to electric vehicles than what many may assume. Yes, of course you are not using gas which we all know comes at a great expense and produces negative exhaust into our atmosphere but there are tons of trickle down effects too that EV cars are preventing. The carbon footprint of EV cars is much smaller than gas powered and this also applies to buses and other forms of transportation that are going electric. As we see in many charts and graphs, the largest carbon footprints come from transportation. With EV trucks, as well as cars, it is not just individual human transportation that can create a smaller carbon footprint. The transportation of goods in larger trucks is a huge beneficiary of promoting shrinkage of our carbon footprint. There are currently 14 states that have adapted California’s zero emission vehicle standards which is to make the pledge of gaining a certain percentage of residents to be driving EV in the following years. Today, less than 1% of cars on the road today are electric but with the following of these standards the goal is to reach 13% by 2035. By 2050, roughly 60% of new care sales are projected to be electric which is an unreal trend for shrinking our carbon footprint!


https://earthjustice.org/features/electric-vehicles-explainer?gclid=Cj0KCQjw06OTBhC_ARIsAAU1yOXrUfiOw95G56jAX46vwnxy1EZH959AqxzRxyVtKFjtaTtx0TlxPJYaAsllEALw_wcB


https://www.nytimes.com/interactive/2021/03/10/climate/electric-vehicle-fleet-turnover.html

Offshore Wind Turbines in California

The state of California is home to 840accessible miles of coast line to the Pacific Ocean. In recent years, as technologies and climate change awareness have increased, the state of California have made a conscious effort to enhance and improve their usage of the coast in its application of renewable energy sources. The most effective form of renewable energy that California has used is taking advantage of the offshore wind. The major tool to capture off shore wind to harness renewable energy comes in the form of wind turbines. Most of which can be built to stand in shallow ocean water. With Californias pacific being much deeper, the turbines must be constructed on to floating stands that are able to absorb currents and other sorts of natural causes that otherwise may alter their movements.

In 2018, the 100 Percent Clean Energy Act was implemented into the state of California. This increased California’s goal of renewable energies to 60% by 2030 and a hopeful 100% by 2045. With oil resources becoming harder to capture and other things such as gas increasing in price, renewable energy sources are the trends of the future. One thing that will not change anytime soon is there being wind off of California’s coastline. If California gets to its goal of 100% by 2045, there will be no energy sources that produce carbon in hopes of altering the curve we viewed a few weeks ago.


https://www.energy.ca.gov/programs-and-topics/topics/renewable-energy/offshore-renewable-energy


https://www.energy.ca.gov/sb100

Holy Cow that’s a lot of water

For this blog I decided to pick a cow as my live stock of focus because my home in Western Massachusetts resides in an area where dairy farms are incredibly prominent. When thinking about livestock such as cows and cattle, one may often think about how much they can provide for us but not often do we think about what farmers need to provide for them, ie, water. A healthy, non milking cow drinks somewhere between 9-12 gallons a day, while a healthy lactating cow drinks roughly triple that in 30-40 gallons a day. Holy cow that is a lot of water. The average human with access to clean water drinks about 3.7 liters a day which is about just under one gallon.

When thinking about water waste, my mind tends to travel to some very simple yet day to day things. Such as long showers or leaving the water running while brushing your teeth but something that strikes me is what I found in regards to food waste. Water is needed to produce basically everything that we eat and drink, therefore if we waste less as humanity, we save more water by having to produce less. In the United Kingdom, roughly 7 million tonnes of food and drink are thrown away each year with nearly 3.5 million tonnes of that still being edible. That is almost 50% less production that would need to occur saving billions of gallons of water.

The main reason that bottled water is so popular is due to its convenience. You can take it wherever you go and it is sold often in large packages. People also tend to have a discomfort with tap water being good to drink more-so than they do with bottled water. If you say there are 2,000 students at Union College, I would estimate that there is somewhere around 250 water bottles used each day. I imagine roughly 12.5% of the community drinks and recycles  (hopefully) at least one bottle a day. This is based off of nearly 20% of Americans using a plastic bottle each day and Union students are far more environmentally cautious than the average American.


https://friendsoftheearth.uk/sustainable-living/13-best-ways-save-water

https://www.plasticsoupfoundation.org/en/2017/07/the-worlds-population-consumes-1-million-plastic-bottles-every-minute/


Is Climate Change at a point of no return? The impact of CO2.

The first class that I took which dove deeply into understanding climate change and its routes was AP Environmental Science my junior year of high school. I took that course in 2018 and have not taken many classes since that contain the same overlapping topics. Because it has been a few years since I learned deeply about the climate change, I focused my research for this blog post about how green house emissions have altered since then and whether or not climate change is reversible. In my readings, I learned that before the Paris Climate Agreement of 2014, it was expected that the Earth’s average temperature would increase by roughly 4.2* celsius by the end of the century would which would have proven to be catastrophic. However, with the advanced focus on saving our planet, the curve has shifted downwards in the last few years projecting a 3* increase, which still is dangerous but there is more room still for the curve to shrink. A huge reason for the positive trend in the temperature curve is due to the increasing availability of save and renewable energy sources such as electric cars, solar, and wind options. The worlds average ocean temperature is roughly 17* F which is one of the main sources of projecting the climate change curve. A shift in that temperature of even .25% either direction will reverse the positive shift in the curve. Water temperature as well as temperature on land again is all directly correlated to green house gas emissions and an abundance od CO2 in the atmosphere.


Cites

https://www.nytimes.com/interactive/2021/10/25/climate/world-climate-pledges-cop26.html


Brian Davis

Hey everyone! My name is Brian Davis and I am from Deerfield, Massachusetts. I am a political science major and history minor and just wrote my thesis on urban gentrification’s impact on varying social classes. I am a member and captain of the men’s lacrosse team and a member of Sigma Chi Fraternity. Reed Karaska who is also in the class is my best friend! I am excited to learn about the ways in which we can apply math to real world issues and problems!