Global Perspective

For my final blog post of the term, I will focus on Global Perspective. A global perspective is a viewpoint that attempts to understand the place of individuals, groups, cultures, and societies in the world and how they relate to each other. An example of a global perspective is studying the implications of economic policies on illegal drug use specifically the supply chain, where the drug is produced, and the local area where the drug is sold.
The link below provides information on the global perspective of climate change. In terms of the math part of this, According to The Fourth Assessment Report (AR4) of the Intergovernmental Panel on Climate Change, the atmospheric concentration of CO2 has increased from 280 ppm in the period 1000–1750 AD to 379 ppm in the year 2005. The concentration of methane in the atmosphere has more than doubled from 700 ppb in the period 1000–1750 AD, to reach a concentration of 1774 ppb in the year 2005. The concentrations of hydrofluorocarbons, perfluorocarbons, SF6, and N2O have also increased. The tropospheric concentration of ozone has increased even though its stratospheric concentration has decreased.


https://link.springer.com/chapter/10.1007/978-1-4020-5774-8_1#:~:text=The%20global%20mean%20surface%20temperature,warmed%20faster%20than%20the%20oceans.



global perspective


Importance of Global Awareness

Seeing that this is the final blog of the term, I reflect back on everything that I have learned throughout this term regarding sustainability and the associated mathematics. I never thought that something as basic as percentages or ratios would play such a big role in sustainability. Consider, the percentage of contamination of a certain substance. Or, the percentage of a substance that is being wasted due to one’s lack of accountability when it comes to sustainability. Learning about energy flow and all the different many different forms of energy was really interesting. It was not until taking this class that I learned that energy has a unit, the unit being Quad. Another important factor that needs to be considered not only through a sustainable lens, but through many lenses in life is precision. If mathematicians are not precise about their measurements and data sets for sustainability related entities, there could be outcomes that are detrimental to the environment. Learning about how many different variables are at play for climate change are overwhelming. But, learning about them individually and ways that we can play our part has been helpful. One of the most notable things that I take away from this course is how large my carbon footprint has been throughout my life. From here on out, I aim to consider the ways in which I can make my carbon footprint smaller for the benefit of the environment. This course has taught me so many new ways that I can think about sustainability and how easy it is to take sustainable action. If we all play a small part in becoming a sustainable nation, our earth will be more likely to succeed.

Living Sustainably- Buy Local!

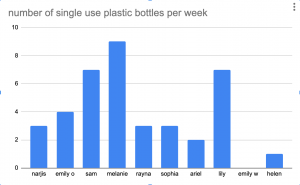
Single Use Plastic Bottles per Week

Single use plastic water bottles are very bad for the environment, typically because they are not recycled and are often thrown out. The plastic takes centuries to full decay and as plastic decays it leaks dangerous chemicals into the groundwater and soil. Even if plastic is recycled, it might not be recycled properly and would still need to decay on the earth. The total carbon footprint of one plastic water bottle is about 828 grams of carbon dioxide. Lots of college students use single use plastic bottles for water, coffee or any other drink. These cups are typically thrown away, adding to the amount of plastic waste in the world. This chart shows that the average number of single use plastic bottles per week is 3.9 amongst the sample size that I gathered data from. The lowest number per week was 0, due to my friend’s constant usage of a reusable water bottle and the highest number was 9. That means per week a college aged student similar to my friends would use 3.9 single use bottles adding up to a 3229.2 grams of carbon dioxide per week released due to this plastic waste.

sources: https://www.greenamerica.org/blog/truth-about-bottled-water


2 Charts That Relate to Sustainability

For this Blog assignment, I made 2 charts. The first chart is a scatter plot chart. The second chart is a line chart. I inserted the links to my charts at the bottom because I can’t figure out how to insert the charts on this blog post.

For the first chart, I found that the average family wastes 180 gallons of water per week. I got this from the link below. I took that number and multiplied it by 4 to find out how much they waste in a month. I multiplied the number of gallons wasted in a month and multiplied it by 2 then 3 then 4 all the way up to twelve to see how much water is wasted for each month in a year. My first chart shows how many gallons of water the average family wastes in a year.

https://www.epa.gov/watersense/statistics-and-facts#:~:text=Water%20Stats,gallons%20of%20water%20annually%20nationwide.

For my second chart, I found out how many pounds of food are wasted by the average American in one month. I got this number from the first link below. I multiplied 20 by 1, 2, 3, all the way up to 12 to find the amount of food wasted for each month.

How Much Food Are You Wasting?


Chart 1: https://docs.google.com/spreadsheets/d/1-jinw_hxVzHjQrjhTdICHVJsv8g13ahH0ajJmawfEXU/edit?usp=sharing

Chart 2: https://docs.google.com/spreadsheets/d/1qin9nFouNjJ76o2g7SPIu-Onwz_c8ffmmFuWSRN7rSc/edit?usp=sharing

Electric Vehicles; a deeper look!

The man that we all know, who just recently bought Twitter, Elon Musk, has paved a positive progression of sustainable growth with the success Tesla has found and its push for others to drive sustainable with electric vehicles. There is a lot more to electric vehicles than what many may assume. Yes, of course you are not using gas which we all know comes at a great expense and produces negative exhaust into our atmosphere but there are tons of trickle down effects too that EV cars are preventing. The carbon footprint of EV cars is much smaller than gas powered and this also applies to buses and other forms of transportation that are going electric. As we see in many charts and graphs, the largest carbon footprints come from transportation. With EV trucks, as well as cars, it is not just individual human transportation that can create a smaller carbon footprint. The transportation of goods in larger trucks is a huge beneficiary of promoting shrinkage of our carbon footprint. There are currently 14 states that have adapted California’s zero emission vehicle standards which is to make the pledge of gaining a certain percentage of residents to be driving EV in the following years. Today, less than 1% of cars on the road today are electric but with the following of these standards the goal is to reach 13% by 2035. By 2050, roughly 60% of new care sales are projected to be electric which is an unreal trend for shrinking our carbon footprint!


https://earthjustice.org/features/electric-vehicles-explainer?gclid=Cj0KCQjw06OTBhC_ARIsAAU1yOXrUfiOw95G56jAX46vwnxy1EZH959AqxzRxyVtKFjtaTtx0TlxPJYaAsllEALw_wcB


https://www.nytimes.com/interactive/2021/03/10/climate/electric-vehicle-fleet-turnover.html

US Energy Consumption

The US in 2018 had a record high energy consumption of 101.3 Quadrillion British thermal units (Btu) then when comparing this to the US consumption of energy in 2020 there was a decrease to 92.94 quadrillions British thermal units. When doing the math this was actually a decay factor of 0.0825. I found that this was interesting that our energy consumption in the US actually decreased during the Covid shutdown. However when I think about it a large part of energy consumption comes from office buildings, factories, and such which were shut down during this time. Reducing your energy consumption is important on an individual level and can have a large effect on your carbon footprint.

Choosing the right Pathwave.

When thinking of livestock, is water the first thing that pops into your head?  I know for me it isn’t.  I think of cows, chicken, and sheep providing milk, meat, and fleece to provide for a sustainable life.  However, when it comes to livestock, the amount of water consumptions cows intake may be harming the environment more than we think.  Now when looking at the water footprint when it comes to beef, producing a kilogram of beef uses around 15,415 liters around alone.  When looking at the statistics, 92% of the world’s global footprint goes towards agriculture.  Why does this matter you may ask? If agriculture uses about 70% of the world’s fresh water, which is 3 times as much as it was 50 years ago.  This is not including the amount of water we use on the daily for other activities such as showering, washing clothes, and doing the dishes.  With the life expectancy of a cow being used before slaughter, a cow would typically drink 24,000 liters of water within their life.  When comparing these numbers its very hard to think of a solution for usage of less water.  Another factor that harms water usage, is the way farmers fertilize their crops with pesticides, contaminating the ground water with nitrogen and phosphorus, that will eventually hurt plant and animal life within the sea.

When it comes to bottled water, students at Union College should definitely think about buying a reusable water bottle rather than buying bottled water at the bookstore everyday.  I specifically think the carbon footprint is extremely high when thinking about FIJI water.  The distance from Fiji to Schenectady New York is around 12,780 km, and yet it’s still a popular drink that many Union students continue to get.  Reusable water bottles also typically hold more water, with an average of 32 oz to a plastic water bottles 16 oz, so not only are you helping the environment, but you’re saving money as well.  This is very important since out of 50 billion plastic water bottles bought by Americans each year, only 23% are being recycled.  I think Union is doing a good job in already placing many filters around campus to encourage the usage of reusable water bottles, but I feel that Union should definitely stop marketing Fiji water in particular even if it “supposedly” tastes better.  If you haven’t already, this is your sign to buy a reusable water bottle!  It will save your pockets (and the environment) in the long run.


resources:

https://case.edu/sustainability/news/making-switch-reusable-bottles

https://eu.boell.org/en/2021/09/07/water-thirsty-animals-thirsty-crops


Why you should use a renewable water bottle

Single-use plastic water bottles have gotten more and more popular since the mid-90s. Currently “around 380 million metric tons of plastic are being produced yearly” which is “ roughly the same as the entire weight of humanity.”  The “average person uses 156 plastic bottles per year” which is around 13 bottles a month. When looking at Union College has a population (staff and students) of around 2,500. To see how much plastic Union College uses in a year, I multiplied the amount an average person uses in a year subtract by a month to make up the loss of students in the summer to the school’s population, which gave me 357,500 plastic water bottles a year. This is an issue because 90% of plastic water bottles do not get recycled and a lot of the time they end up in landfills or oceans for up to 450 lifespans. An average water bottle has a greenhouse gas emission of 58.22 g of CO2. If we compare that to the number of water bottles used at Union college yearly that’s 20,813,630 grams of CO2. In addition, “plastic water bottles are petroleum-based. In the U.S alone, it takes 1.5 million barrels of oil to meet the demands” and globally we use around “17 million barrels of oil to make plastic water bottles every year”. In the end, we should limit the amount of single-use plastic, it has a large impact on the environment, so get yourself a reusable bottle knowing that you are reducing your carbon footprint.

Work Cited:

http://www.watercooler-dispenser.com/articles/How-Much-Oil-Is-Used-For-Bottled-Water.html

https://www.theworldcounts.com/stories/Bottled_Water_Waste_Facts

https://www.earthday.org/fact-sheet-single-use-plastics/