
Biofuel is a fuel derived directly from living matter. Rudolf Diesel, the inventor of the diesel engine, originally designed it to run on vegetable oil. In fact, one of his early demonstrations, at the World Exhibition in Paris in 1897, had a diesel engine running on peanut oil. Biofuels are used as a remedy to use products we grow with the goal to create our net impact on the environment negligible if not zero. For instance, power generation demonstrates that a large quantity of energy goes into producing electricity. In 2008, the world produced about 20,261 TWh of electricity. This is problematic because a large majority of their energy is made from fossil fuels such as coal, a natural gas which contributes to the co2 emissions and the global warming. Biofuel is a great alternative because “the net impact is lower than if the waste were allowed to decompose on its own. This is because natural decomposition in oxygen-rich environments produces nitrogen dioxide, with is over 300 times more potent greenhouse gas than carbon dioxide, as well as methane, which is over 20 times more potent. “ Nonetheless, there are many kinds of biofuels, like ethanol and methanol among others. Ethanol is made by fermenting the sugars from plants such as corn or sugarcane, ethanol contains oxygen that helps a car’s engine burn fuel more efficiently, reducing air pollution. Methanol is used as an alternative biofuel for internal combustion and other engines, either in combination with gasoline or independently. With that being said, currently, biofuels aren’t able to meet our all needs because crop growth isn’t able to meet our demands for energy consumption. Currently there is research around spreading up the production of crops specifically for their energy needs. We are searching for more plans that offer a greater net impact and produce less waste.
Category Archives: Human Society
Waste (in tons) Per Person in Landfills by State in 2019
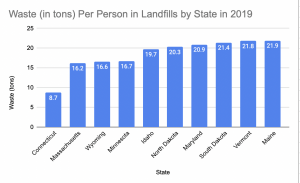
One major issue in today’s society is waste production and management. In recent years, there have been many concerns about a rise in pollution and global temperatures. Ocean acidification and air pollution are two direct results of improper waste management, and these have negative impacts on all of us, and many can lead to long-lasting health conditions and problems. As can be seen in the graph, Connecticut had the lowest per capita waste presence in landfills, with 8.7 tons of waste products in 2019. The next lowest state is Massachusetts, with 16.2 tons of waste byproduct in landfills. The trend continues increasing, with several states remaining in the 16-18 ton range. With regards to North Dakota, Maryland, South Dakota, and Vermont, and Maine, the per capita presence of waste in landfills in 2019 ranged from 20.3 to 21.9 tons, respectively. This is an alarming statistic, and the total gap between Connecticut and Maine is 13.2 tons.
Sources Cited:
https://www.statista.com/statistics/591862/least-waste-per-capita-in-us-landfills-by-major-state/
CO2 Emissions Per Capita Per State
The graph I created is one that shows the annual CO2 emissions per capita per U.S. State with data up until 2017.

(I couldn’t get the chart to upload with better quality for some reason, so please use this link instead to view it as a PDF)
In metric tonnes, this data helps to show the amount of CO2 emissions produced per state per person. When looking at this graph, it is very easy to see where the high amounts of CO2 emissions per capita are found: states like Wyoming, North Dakota, and Alaska stand out as the worst offenders for CO2 emissions per capita. This is in contrast to states like New York, California, Oregon, and Maryland who comparatively have very small CO2 emissions per capita.
This could lead people to believe that states like Wyoming, North Dakota, Alaska, etc. are more responsible for the large CO2 emissions put out annually by the U.S. as opposed to states like New York, California, etc., but that would be incorrect. What this chart tells us instead is that states on this chart that appear to be putting out gargantuan amounts of CO2 are instead putting out large amounts of CO2 in comparison to their population. A state like Wyoming that has a relatively small population but large amounts of farming/agriculture could appear to produce extreme amounts of CO2 compared to a state like New York, when in reality New York could be putting out much more CO2, but due to its large population it doesn’t appear to be as extreme of a CO2 emitter as Wyoming.
WORKS CITED
https://www.eia.gov/environment/emissions/state/analysis/
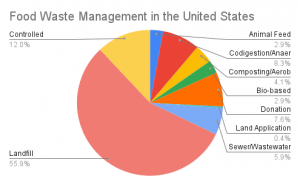
Food Waste management in the U.S.
Food waste is a massive problem in the United States. Currently, a large portion of food is wasted in the United States and this wasted food ends up in various places. These charts document the pathways in where wasted food ends up after it goes unused in 2018. The column chart on the left depicts the weight in US tons of wasted food and approximately how many tons of wasted food end up in each place. As you can see, the largest number of wasted food ends up in landfills with 35,277,543 tons of wasted food managed by landfills. This massive number dwarfs any other pathway for wasted food. For instance, wasted food used on land application is only 259,448. The amount of wasted food that ends up in landfills is 135.97 times greater than the amount of wasted food used for land application. The pie chart on the left details the same numbers however this chart gives the percentages of where wasted food ends up. As you can see more clearly, all other pathways for wasted food combined are less than the percentage of wasted food that goes to landfills. In 2018, 55.9% of all wasted food was sent to landfills and not used in any other constructive way. Out of the 63,132,123 tons of food wasted in 2018, 35,277,543 tons of that food ended up in landfills. Not only is it horribly unsustainable to waste food, but the methods in which wasted food is used afterwards is even more unsustainable and is contributing to the problems that we are seeing today.

Works Cited:
https://www.epa.gov/facts-and-figures-about-materials-waste-and-recycling/food-material-specific-data#:~:text=The%20estimated%2035.3%20million%20tons,percent%20of%20all%20MSW%20landfilled.
Recycling and composting trends (1960-2018)

I complied a bar graph that showed the percentage increase in the number of different materials that was increased from 1960 on. This shows that through the years the amount of things recycled has increased along with having more things being able to be recycled. This could be caused by the increase in education and the advancements in technology.
| 1960 | 1970 | 1980 | 1990 | 2000 | 2005 | 2010 | 2015 | 2017 | 2018 | |
|---|---|---|---|---|---|---|---|---|---|---|
| Paper and Paperboard | 17% | 15% | 21% | 28% | 43% | 50% | 63% | 67% | 66% | 68% |
| Glass | 2% | 1% | 5% | 20% | 23% | 21% | 27% | 28% | 25% | 25% |
| Plastics | Neg. | Neg. | <1% | 2% | 6% | 6% | 8% | 9% | 9% | 9% |
| Yard Trimmings | Neg. | Neg. | Neg. | 12% | 52% | 62% | 58% | 61% | 69% | 63% |
| Lead-acid Batteries | Neg. | 76% | 70% | 97% | 93% | 96% | 99% | 99% | 99% | 99% |
Data from the United States Environmental Protection Agency. National Overview: Facts and Figures on Materials, Wastes, and Recycling.
(sorry if the image is blurry- my laptop was being difficult)
Single Use Plastic Bottles per Week
Single use plastic water bottles are very bad for the environment, typically because they are not recycled and are often thrown out. The plastic takes centuries to full decay and as plastic decays it leaks dangerous chemicals into the groundwater and soil. Even if plastic is recycled, it might not be recycled properly and would still need to decay on the earth. The total carbon footprint of one plastic water bottle is about 828 grams of carbon dioxide. Lots of college students use single use plastic bottles for water, coffee or any other drink. These cups are typically thrown away, adding to the amount of plastic waste in the world. This chart shows that the average number of single use plastic bottles per week is 3.9 amongst the sample size that I gathered data from. The lowest number per week was 0, due to my friend’s constant usage of a reusable water bottle and the highest number was 9. That means per week a college aged student similar to my friends would use 3.9 single use bottles adding up to a 3229.2 grams of carbon dioxide per week released due to this plastic waste. 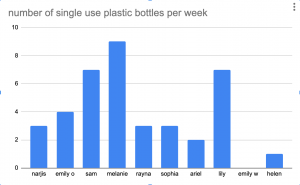
sources: https://www.greenamerica.org/blog/truth-about-bottled-water
Gasoline prices and population in New York City Boroughs
This graph displays the gas prices in 3 boroughs in New York city per gallon. All three boroughs have a similar range but the trend shows that Bronx has the highest price in gas despite having the lowest population. The effect of having to pay more for gasoline despite being the lowest populated. support the idea that both boroughs nearby spend less money on gas therefore may be marginally richer to spend on other things.
References:https://www.numbeo.com/gas-prices/in/Bronx
Gallons of Water Wasted Per Day
For this week’s bog topic, I thought it’d be interesting to reach out to my friends and see how many gallons of water that they believe that they waste a day. Water waste is a huge issue when it comes to sustainability across the globe. Water can be wasted in many different ways and I feel that is often over looked. For example, keeping the water running when you brush your teeth, taking too long of showers, pouring out drinking water, etc. After reaching out to 10 of my friends, I put the data into a bar graph, which is pasted below;

The range of answers is quite obvious as one of my friend’s stated that she doesn’t waste any water, meanwhile, another one of my friend’s claimed that she wastes 20 gallons of water a day. By asking my friends this question, it was intended to make them think of all of the ways that they waste water and in return think of the ways that they can reduce water waste. Making these small changes can have a big impact on our globe.
Single-use Plastics at Union
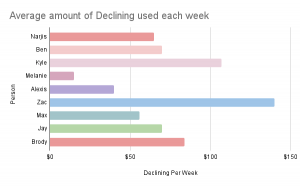
This graph shows the average amount of declining these individuals spend at Union per week. Declining is used outside of the dining halls therefore every item is individually wrapped or bottled. There are no reusable dishes or cutlery. Hence the more declining spent per week, the more single-use plastics and waste there is. From this bar chart, we can infer that Zac uses and wastes the most single-use plastics.
Average Time my friends spend doing homework
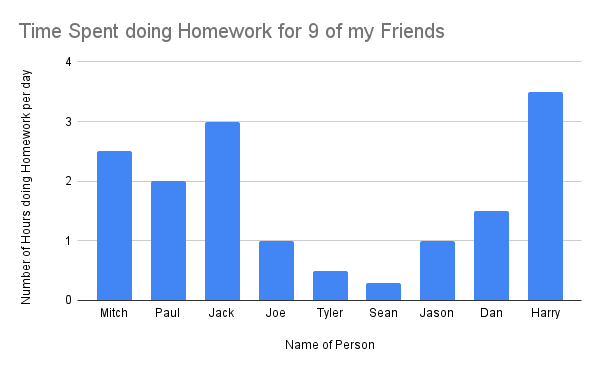 This is a graph that I made about the average amount of time that 9 of my friends spend doing homework per day. The Y-axis is the number of hours spent doing homework, whereas the x-axis is the name of my friend.