
One way I can contribute to becoming more sustainable for the Earth and for further generations and is minimizing my water bottle use. I estimated I use four plastic bottles per day and that is over a thousands bottles per year. If I can start using re useable bottles, the earth will benefit immensely.
Tag Archives: CO2
Recycling for Sustainability
source : https://www.greenamerica.org/blog/truth-about-bottled-water
CO2 Emissions Per Capita Per State
The graph I created is one that shows the annual CO2 emissions per capita per U.S. State with data up until 2017.

(I couldn’t get the chart to upload with better quality for some reason, so please use this link instead to view it as a PDF)
In metric tonnes, this data helps to show the amount of CO2 emissions produced per state per person. When looking at this graph, it is very easy to see where the high amounts of CO2 emissions per capita are found: states like Wyoming, North Dakota, and Alaska stand out as the worst offenders for CO2 emissions per capita. This is in contrast to states like New York, California, Oregon, and Maryland who comparatively have very small CO2 emissions per capita.
This could lead people to believe that states like Wyoming, North Dakota, Alaska, etc. are more responsible for the large CO2 emissions put out annually by the U.S. as opposed to states like New York, California, etc., but that would be incorrect. What this chart tells us instead is that states on this chart that appear to be putting out gargantuan amounts of CO2 are instead putting out large amounts of CO2 in comparison to their population. A state like Wyoming that has a relatively small population but large amounts of farming/agriculture could appear to produce extreme amounts of CO2 compared to a state like New York, when in reality New York could be putting out much more CO2, but due to its large population it doesn’t appear to be as extreme of a CO2 emitter as Wyoming.
WORKS CITED
https://www.eia.gov/environment/emissions/state/analysis/
CO2 Emissions by Country
Of course we know now that emissions of carbon dioxide are incredibly harmful to our earth and the ozone. As one of the most prominent and dangerous green house gasses, limiting carbon dioxide emissions is crucial to saving our planet before it heats up to a point of no return. The graph that I am going to conduct is relatively simple but it will be stats on some of the largest and most industrialized countries in the world and the numbers that relate to their C02 emissions.
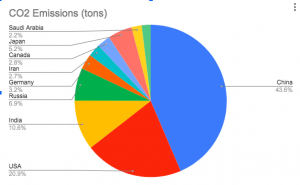
These ten countries make up nearly 70% of the worlds CO2 emissions and of these 10 countries, China make sup 43.6% of the emissions. These countries are all very industrialized and have shown large jumps in population growth. If that growth continues, some policies have to implemented to lower these emissions!
The Sustainability of Electric Cars
Emissions from cars and transportation are undoubtedly some of the largest producers of CO2 emissions that we can see today. However not all hope is lost as companies such as Tesla have attempted to become more sustainable and limit CO2 emissions. These are seen with electric cars that have become very widespread today. Tesla was founded with long term sustainability efforts in mind as opposed to the current trend of trying to lessen environmental pollution but not get at the source of the problem. Electric cars charged on a power grid emit 4,000 lbs of CO2 as opposed to gasoline vehicles which emit 11,000 lbs of CO2. Better yet, electric cars that are charged on renewable forms of energy such as wind and solar emit 0 lbs of CO2. Despite the fact that batteries for electric vehicles create more pollution during construction than combustion-engine vehicles, because of the lower emissions over the entire life of the electric vehicle, the pollution is less overall than combustion-engine vehicles. With the average commute to work being 28 minutes, driving an electric vehicle as opposed to a gasoline powered vehicle is the more sustainable choice. Tesla also states in its website that end-of-life products such as electronics with a size of up to 25cm can be returned to be recycled at Tesla locations at no cost. To return other products an appointment can be scheduled for the take-back. Electric cars seem to be a very important step towards a more sustainable future.
Works Cited:
https://www2.census.gov/programs-surveys/sis/resources/earth-day-ff.pdf
https://www.pca.state.mn.us/air/electric-vehicles#:~:text=Much%20like%20with%20greenhouse%20gases,operating%20and%20during%20power%20generation.
https://www.tesla.com/en_IE/support/sustainability-recycling
https://www.imd.org/research-knowledge/articles/tesla-becomes-a-model-for-sustainable-leadership-david-and-goliath-revisited/
Never Pay for Gas Again
One engine for carbon dioxide emissions into the atmosphere has to be the driving of cars to various locations. With millions of people needing to drive to work or other activities this leaves the atmosphere and our planet earth taking the hit. It is determined that every gallon of gasoline burned creates about 8,887 grams of carbon dioxide. Now think about how many cars are on the road and how many people go through gallons of gasoline everyday, week, month, and year. The typical car releases 4.6 metric tons of carbon dioxide per year and this is an extreme amount. If we can reduce the amount of vehicles on the road this problem can be solved. One way to solve this is to turn to electric vehicles. Many high end brands such as Tesla and Audi have developed electric cars but those certainly are not affordable for millions of people in America. Recently cheaper, more affordable car companies are producing electric cars such as Toyota and Nissan. If Americans can become aware of the environment and the emissions of Carbon Dioxide they could be interested in investing in an electric car. Not to mention the extremely expensive gas prices all throughout the U.S., whereas electric cars require no gas. For those that do not have interest in electric cars, there are several other options to protect this earth such as carpooling, trains, and biking. Not every single American will listen to these suggestions, but little at a time I hope America can transform into an electric car dominated country.
References:
https://www.epa.gov/greenvehicles/greenhouse-gas-emissions-typical-passenger-vehicle
Carbon Emissions
The United States emitted a grand total of 5,222 million metric tonnes of CO2 in 2020, which was an 11% decrease following the height of the COVID-19 pandemic, but this downward trend would prove to be only temporary. However, in comparison to 2005 CO2 emission levels, there was a 21% decrease, which I found to be interesting. In 2020 alone, carbon dioxide accounted for ~79% of GHG emissions, while nitrous oxide, methane, and various fluorinated gases made up the other 21%. 27% of these emissions were caused by transportation alone, electricity contributed to 1/4 of these emissions, and the rest were sectioned off into industry, commercial usage, and, unsurprisingly, agricultural energy consumption. Ten years prior, the overall emission measurement (circa 2010) fell around 5,594 million metric tonnes, which while not a huge difference, really puts things in perspective. If we could somehow figure out a balance between all the above aspects of everyday life, and managed to cut back on energy consumption in a realistic yet sustainable way, it would be for the better.
sources:
https://www.epa.gov/ghgemissions/inventory-us-greenhouse-gas-emissions-and-sinks
https://www.statista.com/statistics/183943/us-carbon-dioxide-emissions-from-1999/
CO2 Emissions Rise
Continuing a blog topic from 2 posts ago, I wanted to zero in on the rise in CO2 emissions during my lifetime. I was born in 2002, where global CO2 emissions were 26.04 billion tonnes. Fast forward to our most recent data, with the 2021 global CO2 emissions were 36.4 billion tonnes. That’s a total change of 10.36 billion tonnes. The percent change of that data would roughly be a 40% (39.78%, to be exact) increase with a growth factor of 1.4.
While there has been some fluctuation in recent years due to the COVID-19 pandemic in 2020, on average the increase in emissions has remained steady. It’s scary to think about, but the total change, percent change, and growth factor could all possibly be even larger if the pandemic hadn’t happened. It’s important to reduce our personal, every day CO2 emissions, and hopefully we’ll live to see a time where the CO2 emissions have a decay factor instead.
Sources:
https://www.statista.com/statistics/276629/global-co2-emissions/
Offshore Wind Turbines in California
The state of California is home to 840accessible miles of coast line to the Pacific Ocean. In recent years, as technologies and climate change awareness have increased, the state of California have made a conscious effort to enhance and improve their usage of the coast in its application of renewable energy sources. The most effective form of renewable energy that California has used is taking advantage of the offshore wind. The major tool to capture off shore wind to harness renewable energy comes in the form of wind turbines. Most of which can be built to stand in shallow ocean water. With Californias pacific being much deeper, the turbines must be constructed on to floating stands that are able to absorb currents and other sorts of natural causes that otherwise may alter their movements.
In 2018, the 100 Percent Clean Energy Act was implemented into the state of California. This increased California’s goal of renewable energies to 60% by 2030 and a hopeful 100% by 2045. With oil resources becoming harder to capture and other things such as gas increasing in price, renewable energy sources are the trends of the future. One thing that will not change anytime soon is there being wind off of California’s coastline. If California gets to its goal of 100% by 2045, there will be no energy sources that produce carbon in hopes of altering the curve we viewed a few weeks ago.
https://www.energy.ca.gov/programs-and-topics/topics/renewable-energy/offshore-renewable-energy
https://www.energy.ca.gov/sb100
Greenhouse Gases and our Sustainability Efforts
Greenhouse gases contribute to many dangers in sustainability efforts and these greenhouse gases have been closely monitored by the EPA, with the government organization monitoring the rises and sinks of greenhouse gas emissions and the biggest contributors to greenhouse gas emissions in the United States. I believe that sustainability efforts should first and foremost look to reduce the amount of CO2 and other greenhouse gas emissions that we are placing into the world. The US emissions totaled 5,222 million metric tons of CO2 equivalents in 2020. This is an 11% decrease from 2019 with the total change from 2019 to 2020 decreasing from 5796.42 million metric tons to 5222 metric tons. This resulted in a 574.42 million metric ton decrease in CO2 emissions. This was largely due to the pandemic as well as the continued search for more renewable and sustainable forms of energy.
One interesting topic I found regarding sustainability GHG emissions, especially CO2 emissions is electric cars. While electric cars are better for the environment, the deciding factor on the sustainability is how much is required to produce these electric cars. An all electric Chevrolet Bolt produces 189 grams of CO2 for every mile, as opposed to a gas fueled Toyota which produces 385 grams of CO2 per mile. However the challenge comes in the production of electric cars and the energy grid. It is important to understand that just because a car is electric might not mean it is as sustainable as it seems. This issue concerning electric cars relates back to my main point earlier about greenhouse gas emissions. We as people need to look to find the best possible solutions to decrease the harm we are doing to our planet.
Works Cited:
https://www.epa.gov/ghgemissions/inventory-us-greenhouse-gas-emissions-and-sinks
https://www.epa.gov/ghgemissions/sources-greenhouse-gas-emissions#colorbox-hidden
https://www.epa.gov/greenvehicles/electric-vehicle-myths
https://www.nytimes.com/2021/03/02/climate/electric-vehicles-environment.html