HISTORICAL PRICING DATA
The first type of data the I utilized was historical pricing data, which included the open, high, low, close and volume. On average, making day-ahead predictions with this data resulted in an accuracy of predicted price movements between 70-75%. This is reflected in the sample test results shown in Table 11 below. The error between the predicted price change and true price
Table 11: Three-Year Historical Data as Input Features (One-Day Forecast)
change is still sizeable for some stocks, but its relative error compared to other test was at least no larger. The, the number of days predicted was increased to seven-days, and a sample of the results are shown in Table 12 below.
Table 12: Three-Year Historical Data as Input Features (Seven-Day Forecast)
Immediately, the amount of error per prediction increased significantly. The algorithm’s ability to predict stock price changes correctly dropped from 70-75% to 55-60%. Still, the algorithm appears able to predict if the stock price has an overall trend. As a result, the algorithm’s use of its predictions to make investments is sometimes able to outperform the market benchmark when the real stock price is going down. Then, the same type of historical stock price data was used over a one-year span to make day-ahead and seven-day ahead forecasts. The performance of the day-ahead forecasts was similar to that using three-year data with an accuracy from 70-75% overall. Some of the sample test results are shown in Table 13 below.
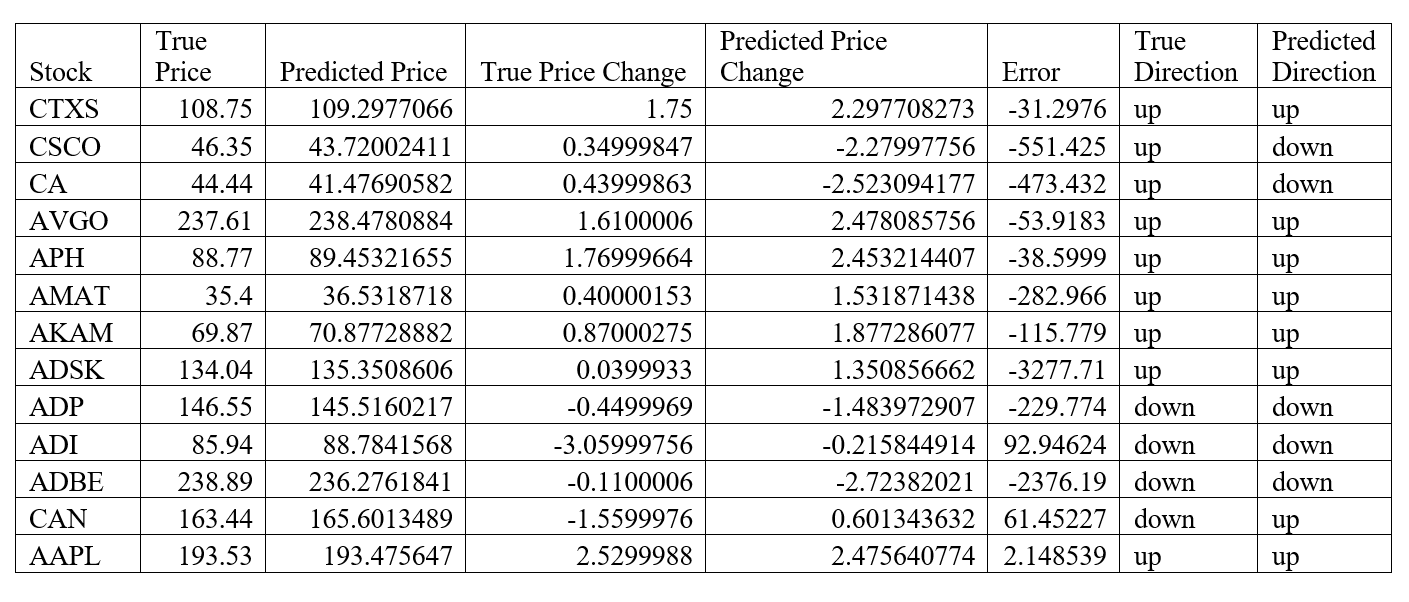
Table 13: One-Year Historical Price Inputs for Day-Ahead Forecasts

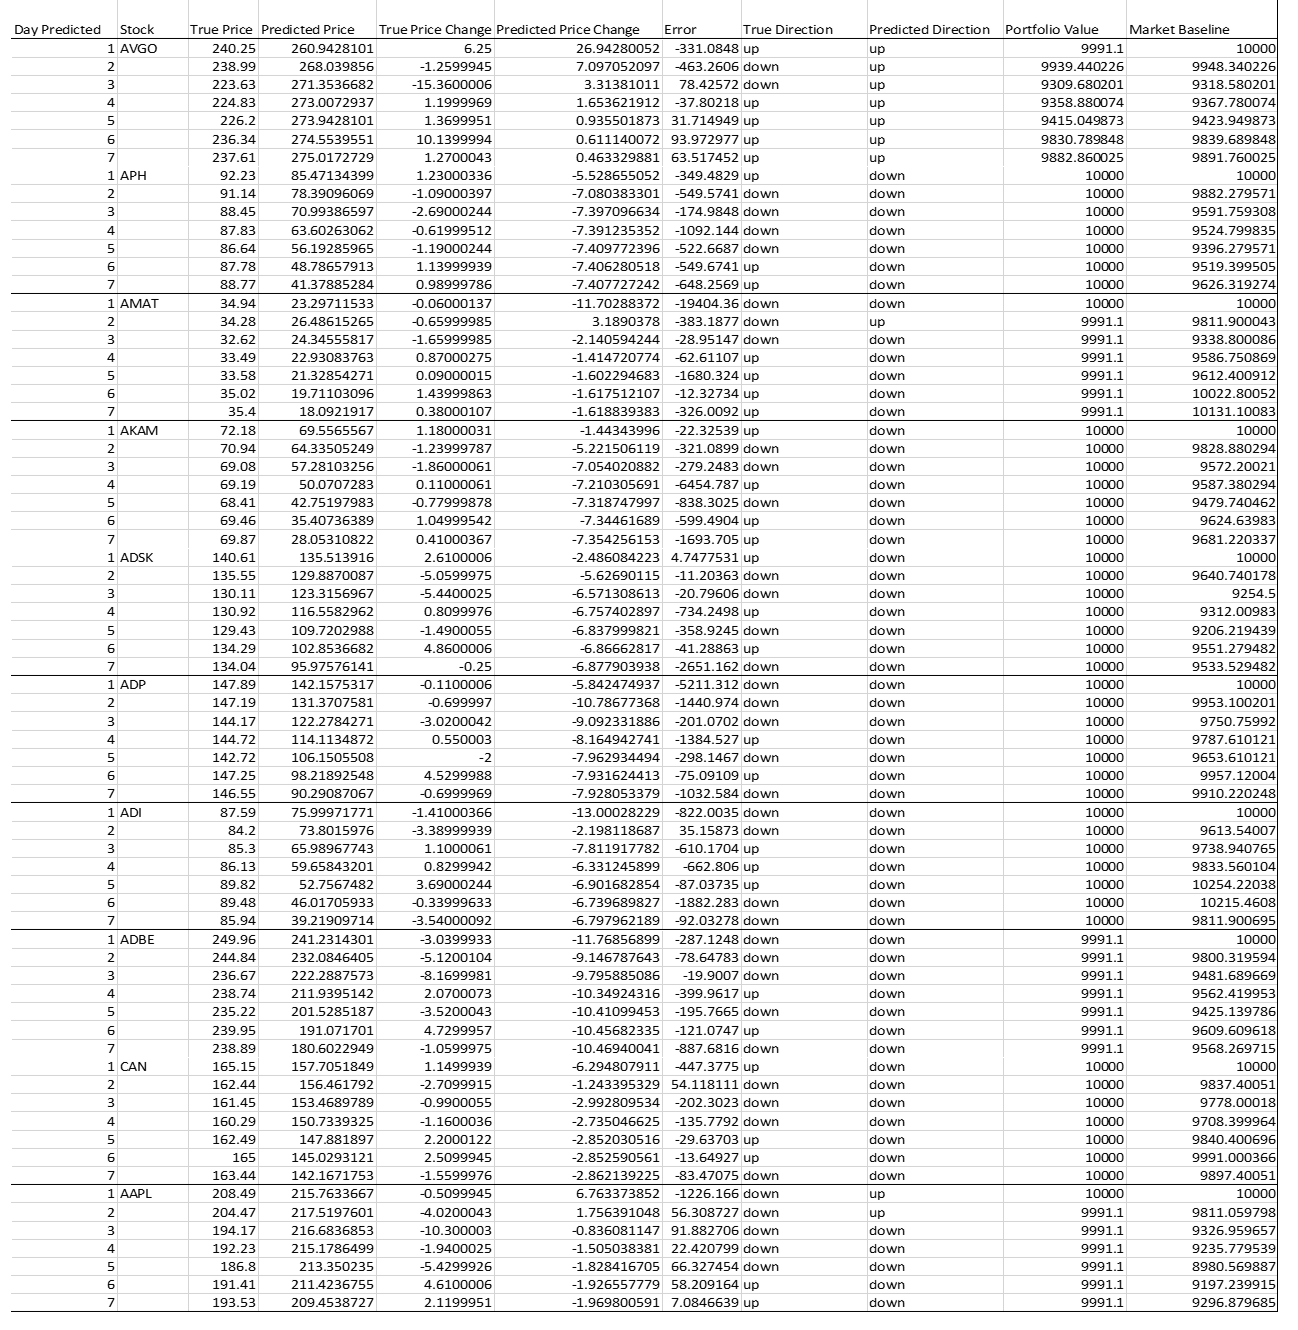
When these forecasts were extended to seven-day ahead forecasts, the predictive performance using one-year data fell short of the three-year data (as shown in Table 14 below). The predictive performance dropped to just above 50% on average. Unlike the predictions using three-year data, which was able to predict if a stock was trending downwards and detect more notable changes in trend, the predictions using one-year data virtually never predicted a trend reversal, especially if there was a downward trend. Such a result could be detrimental and can result in large losses in the market if prices took a downturn. It can be seen that the algorithm’s
Table 14: One-Year Historical Price Inputs for Day-Ahead Forecasts

almost inability to predict downward movements causes it to take losses and underperform the market baseline consistently. Fig. 20 and Fig. 21 below show predictions on the same stock (AMAT) using both 1-year and 3-year data. This is representative of how using 3-year data as input seemed to increase the predictive accuracy of the model.

In the next set of experiments, the time period of historical data was shortened even more to one month-data to make next-day predictions. This short input timeframe further degraded the performance of the algorithm, which again was virtually never able to detect when there was a reversal in stock trend, resulting in predicting accuracy of between 45-50%, which is an undesirable level of accuracy. Some sample results are shown in Table 15 below:
Table 15: One-Month Historical Price Inputs for Day-Ahead Forecasts

As a result of the experiments, we can see that next-day price predictions yield more accurate predictions more consistently when 1-year and 3-year historical price data is used. When too short of a time span is used (such as one month) the predictions are less sensitive to the day-to-day fluctuations in stock price. However, for even the 1-year and 3-year historical data, as soon as the number of days predicted out increases, there is a rapid increase in the error of the actual magnitude of the predicted price change. For much of this section, we have focused on the direction of the price changes as this is an important metric for investors. Still, the magnitude of the price change does carry importance as it would help investors better allocate funds, however, for all of the predictions there were large, increasing degrees of these errors. An example of this is represented in Fig. 22 and Fig. 23 below.

As discussed (even with correct predictions of directional stock movement), the increasing error over time does cost investors. One example from our sample testing of this is the following. For a seven-day forecast, the algorithm correctly predicted the movement of AAPL’s stock prices the majority of the time, but there was a large degree of error in the magnitudes of the price predictions (as exemplified by Fig. 20 and Fig. 21 above). As a result, the fund allocation was not at an optimal level, and the portfolio value did not outperform the market benchmark, as shown in Fig. 24 below:
Fig. 24: Cost of Price Prediction Error to Earnings

ADDING TECHNICAL INDICATORS
Because the three-year data outperformed the other input timeframes, this input time frame was utilized moving forward for making predictions. The same historical price data continued to be used in this set of experiments, but different combinations of technical indicators were also used. The first combination of technical indicators consisted of the Chaikin A/D Oscillator, the Average True Range, Simple Moving Average, and Aroon Oscillator. A sample of day-ahead predictions using these technical indicators is shown in Table 16 below:Table 16: Day-Ahead Forecasts Using Historical Data & Technical Indicator Combo 1 On average the accuracy of the price changes using a technical indicator for one-day ahead forecasts is between 65-70%. However, there is a large increase in the degree of error of the price change as compared with just using historical prices. Extending these predictions out to a seven-day period only magnifies this error even further, and the accuracy decreased.
Table 17: Seven Day-Ahead Forecasts Using Historical Data & Technical Indicator Combo 1

As shown by the sample results in Table 17 above, using technical indicators may be able to pick out an underlying trend, but is unable to effectively detect day-to-day price fluctuations, a result that could lead to serious losses in financial investing. This result carried through to our other combinations of technical indicators. The second combination consisted of Exponential Moving Average, Relative Strength Index, Average True Range, and Chaikin Oscillator. The third combination consisted of the Parabolic SAR, Commodity Channel Index, Average True Range, and Chaikin Oscillator. None of these combinations conclusively outperformed each other. In general, the observations that held true for the first combination of technical indicators held true for these, which is shown by the results in Table 18 and Table 19 below.
Table 18: 7-Day Price Forecasts with Historical Prices and Technical Indicators as Inputs

Based on the results shown in Table 18 above, it can be seen that the high degree of error in these predictions using technical indicators translates into how well an investor’s portfolio would perform using these predictions. The incorrect predictions would cause the investor to consistently underperform the market. This effect is either due to the predictions failing to recognize moments when the price is changing from an increasing trend to a decreasing trend or a failure to capitalize on opportunities where price is increasing. These combinations of technical indicators were also utilized to perform 30-day ahead predictions, resulting in an average of 50-53% accuracy in selecting the proper price movement consistently for all stocks tested.
FUNDAMENTAL DATA
The final set of inputs that were fed into the predictive algorithm were historical prices combined with the fundamental data. Specifically, this fundamental data included the price-to-earnings ratio, the ISM manufacturing index, ISM non-manufacturing index, housing permits issued, and the consumer sentiment index. (To see the actual fundamental data that was utilized please refer to the appendix). The average results over our IT sector stocks on the accuracy of the projected direction of stock price movements are given in Table 19 below.
Table 19: Comparison between historical, fundamental, and technical inputs.
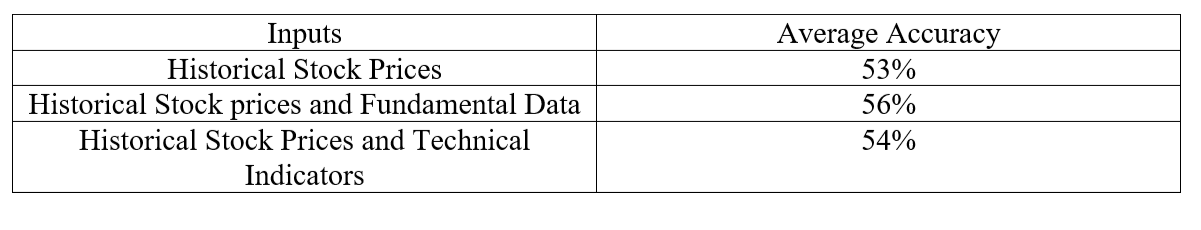
In this test, the month projected over was one where a company released a quarterly report just after day 15 within the days forecast. As shown in Fig. 23, the fundamental inclusion of fundamental data was able to detect this change in price (unlike the usage of only historical input prices). Each method was clearly able to pick up on the downtrend in the stock, but failed to pick up on the day-to-day fluctuations where the stock would increase before returning to its overall decreasing trend.
Fig. 24: Long-term Stock Predictions Example

Our results show the following implications for long-term forecasting. Historical stock prices seem to yield the best results for shorter-term predictions, and error quickly accumulates in the longer term the fastest of our three different types of inputs. Technical indicators seem to provide predictions with more information about the actual trend that stock prices are moving in in the long-term than simply historical prices, but fundamental data sees to provide the best metric (when paired with historical data) in giving better predictions about the long-run.( It should be noted that this is the case when quarterly reports are released, but otherwise in the middle of quarters, the fundamental data seems to have virtually no effect on predicted prices.)
Recent Comments