Global Engagement- Getting Everyone On Board

It seems that more people are aware of sustainability than we think. Whether or not they choose to act in sustainable ways is a different story. 74% of adults (One out of every three adults) globally are aware of the United Nations Sustainable Development Goals (SDGs)! The survey, conducted for the Forum by Ipsos Group, asked almost 20,000 people aged between 16 and 74 from 28 countries how familiar they were with the SDGs and which SDGs they thought were the most important. The 17 SDGs represent the UN’s 2030 Agenda for Sustainable Development plan calling for global collaboration to address pressing world problems including the climate crisis, poverty and the gender gap.Globally, Great Britain and Japan rank lowest in terms of familiarity, with 51% having never heard of them. Here at home, 50% of respondents in the United States have never heard of the SDGs whereas in comparison, 92% of respondents in Turkey have heard of them. The top-ranked SDGs are those related to humanitarian human needs, including zero hunger, clean water and good health. Age also has an effect on sustainability knowledge and practice. There was an apparent demographic variance in responses that was significant. Perhaps not unexpectedly, the survey found respondents under the age of 35 were the most aware of the SDGs, with 9.6% reporting that they were “very familiar” with them, compared to 6.3% of those aged 35 to 49 and 2% of those aged 50 to 74. Only 23.1% of under-35s said they have never heard of the goals, compared to 25% of 35- to 49-year-olds and 29% of those aged between 49 and 74. This shows us that the world is more aware than we think they are on sustainability , but also that we have a ways to go on educating.

Works Cited:
https://www.weforum.org/press/2019/09/global-survey-shows-74-are-aware-of-the-sustainable-development-goals/

Wind Energy and the Economy!

We feel it virtually every week- the strong or sometimes subtle feeling of air rushing against us- wind energy. Wind energy is so prospective in part due to its far less greenhouse-gas emission properties as compared to fossil fuels. Wind energy is classified as renewable, under the condition that there is wind and that one day all wind and air currents cease to exist. While many argue for more windmills and turbines, it is important to note that wind energy is less efficient than coal or natural gas, in part due to the the irregularity of wind’s nature. A Purdue University study that models increased wind production in 10 states shows significant economic impact in those states, as well as billions of dollars spread over the rest of the country. This study stated thatwind power in the top 10 wind-producing states would create billions of dollars of economic impact. States that add wind power would see about $24 billion in activity, while other states would see $3 billion in spillover economic activity. This amount of money and economic activity is worth looking at, especially as a potential for future investors at home and abroad. A fun fact is that the U.S. currently has more than 100,000 MW of operating wind capacity, according to the American Wind Energy Association. Thus, adding 500 MW in 10 states would be only a 5% increase but would have significant economic benefits. Coal and other fossil fuels are much cheaper, but are nonrenewable…making a case for a bigger future for wind energy in the United States and around the world…We’ll just have to see!

Works Cited:
https://www.purdue.edu/newsroom/releases/2020/Q2/analysis-wind-energy-expansion-would-have-27-billion-economic-impact.html

Weekly Seatbelt Time

This week I decided to involve some of my friends in an investigation into roughly how long Union students spend in a car weekly. I decided to ask the simple question, “How long, roughly, do you think you spend in a car per week?” and recorded the responses I received. The data represents the amount of minutes a handful of Union students spend weekly in a car. The data reflects 50% of those interviewed spend 30 minutes or less in a car weekly and 50% spend more than 30 minutes in a car weekly. I was pleasantly surprised to find that all individuals I interviewed spent under an hour in a car on-average, which is limiting their carbon footprint on the environment when they are at school. The data is possibly a reflection of the small size of Union contributing to students choosing to walk distances instead of driving them. The warmer weather we are experiencing may also be contributing to this data.

Food Insecurity

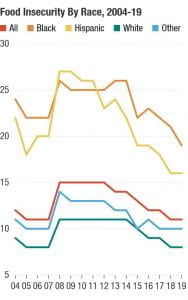
Food insecurity is defined as a household-level economic and social condition of limited or uncertain access to adequate food. This is an unfortunate but prevalent problem in our world and nation today. Data also shows that food insecurity happens in some communities more than others. Specifically, data shows that Black and Hispanic Americans are particularly disproportionately affected. Identifying these inequalities/inadequacies is the first step in attempting to correct/fix them. According to USDA data, 19.1% of Black households and 15.6% of Hispanic households experienced food insecurity in 2019. White Americans fell below the national average, with 7.9% experiencing food insecurity.These percentage statistics portray how common food inadequacies are among Americans and how race plays a role. It is difficult for many of us to imagine not having enough food in our stomachs or worrying about our next meal(s), but that is a sad reality facing Americans. Outside of race, food insecurities appear to be directly affected by level of education and ability to work. College graduates experienced food insecurity at a rate of just 5% last year. For those without a high school degree, the rate skyrocketed to 27%. Adults who have a disability — in particular adults who have a disability and are not in the work force — also experience more than two times the rate of food insecurity as adults who do not have a disability. It is interesting to see how a college degree (and lack thereof one) impact rates of food insecurity. I think it is safe to say that there is a direct link between financial situations and food insecurities based on these statistics, with obtaining a job affecting one’s ability to buy and consume food for themselves and their families. I would be interested to know how common food adequacies are in the state of New York and Schenectady. The graph below shows how food insecurity is affected by race.

Works Cited:
https://www.npr.org/2020/09/27/912486921/food-insecurity-in-the-u-s-by-the-numbers

ESG Scores

I had never heard of an ESG score in my life. An ESG score stands for Environmental, Social, and Governance score. These are ratings that measure a company’s exposure to environmental, social, and governance risks. These risks include worker safety, energy efficiency, and board independence and all of these have financial implications. ESG scores/ratings can influence investors and may sway them for or against a specific company. What is interesting is that recent studies are showing that a 10 percent increase in corporate disclosure is associated with a 1.3 to 2 percent increase in ESG score variation among major ratings providers, which all interpret and process disclosures differently. More importantly, they are showing that the more information a company discloses about its ESG practices, the more rating agencies disagree on how well that company is performing along these dimensions. By being transparent about their ESG scores, companies are actually disadvantaging themselves! This seems contradictory but that is why the latest research is shocking. These companies have a lot to lose with more than $30 trillion in sustainable investment capital on the line…Investors are dumping massive savings into companies they believe will help provide sustainable futures, so if their transparency is allowing the rating agencies to hurt the company, then the investors will hurt financially as well. If these investors pull out on their investments, many promising companies looking to change the world by preaching sustainability may go out of existence. This newest research raises questions on the effectiveness of the rating system and if the rating agencies need further regulation. I think most people would agree that all companies and corporations in the United States need some oversight to make sure they are not harming the environment, but maybe the rating agencies need additional oversight as well.

Electric Mobility

Electric cars are new and interesting with technology that has never been seen before. In our lifetimes, we have seen the rise of electric cars as well as the adoption of many motor companies producing hybrid cars. Even our college has electric car charging stations. The use of electric cars has been gradual and patient over time. With the current price of gasoline, many individuals are considering alternate modes of transportation that are more eco-friendly than traditional gas cars. In 2012 there were only 130,000 electric cars sold worldwide. While this is a number larger than I expected for that year, this number is nowhere near what it is modern-day. In 2019, comparatively, 2.2 million electric cars were sold. This represented 2.5% of global car sales. In 2020, the number of electric car rose to three million and represented 4.1% of total car sales. This trend continues with 6.6 million electric cars being sold in 2021 accounting for 9% of the global car market. The change from 2012 to 2021 is a staggering 4976% change. The global adoption of alternative fuel sources is leading to new technologies for human transportation. Those numbers alone from 2012 to 2021 show how popular and promising electric vehicles can continue to be moving into the future. Some food fo thought is although we are moving in a cleaner car direction… if 6.6 million electric cars were sold last year, how much carbon emissions were emitted in the production of so many cars? (Although these cars are better for the environment and reduce an individual’s carbon footprint, it is inevitable for carbon emissions to be attached to the production and transportation of electric vehicles before they are purchased and driven off the lot). It has been estimated that there are now around 16,000,000 electric cars on the road worldwide, but while electric car’s are being consumed at a higher rate, this is being offset by a parallel increase in the sale of SUV’s. It will be interesting to see what the automotive industries do in the coming years and how the auto-market will react and balance. Stay tuned.

Sources:
https://www.iea.org/commentaries/electric-cars-fend-off-supply-challenges-to-more-than-double-global-sales

Sheep Consumption of Water in the United States

Sheep are are a staple of farms across the country not only for their relationship with humans as a food source, but also as a source of wool. Sheep are able to obtain most of their water needs from their food/forage consumption. However, they still are consuming water at a constant rate that is worth examining.Lambs weighing 5-10lbs consume roughly 0.1-0.3 gallons of water per head per day. Feeder lambs weighing in the range of 60-110lbs consume roughly 1 gallon to 1.5 gallons per head per day. Pregnant ewes weighing 175lbs and higher consume between 1-2gallons of water per head per day. Lactating ewes weighing 175lbs and higher consume between 2-3 gallons per head per day. Lastly, rams weighing 175lbs and higher consume between 1-2 gallons per head per day. Dirty or stale water on farms and livestock acreage can lead to a reduced consumption of water by sheep. Clean water is so important for the health of the livestock and the health of its meat for human consumption.

Obviously dirty or contaminated water is not ideal for animal drinking, but we can not expect every farm in the country to provide flawless and pristine water to its animals in a similar way that we cannot expect all cities to provide perfect drinking water to its inhabitants. Requirements for livestock water consumption is linked to size, productivity, diet and environmental conditions. Good water quality can lead to an increase of water intake while reduced water consumption can lead to dehydration- a problem which can be fatal to sheep and other livestock. Dirty water is a hotbed for diseases and bacteria and can spread rapidly if sheep drink from the same source.

Waterers can be disinfected using a dilute bleach solution following cleaning. A dilute bleach solution of 2 to 3 ounces for each 50 gallons of tank capacity of bleach containing 5.25% sodium hypochlorite applied weekly also will suppress algae growth. This disinfection is crucial to maintaining healthy drinking water supplies for sheep and other livestock.It is important to note that proper installation of the waterer or tank base will prevent fecal contamination of water. The base should be wide enough so animals are able to place their front legs on it easily while drinking, but not their hind legs. This will keep animals from defecating in the water which would lead to illnesses among sheep and other livestock. There are estimated to be 5.2 million sheep in the United States.

If we were to assume that it is an even 50/50 split between rams and ewes on farms, we can calculate a range of sheep water consumption in the United States per year. Male sheep, rams, can be estimated to be between 2,600,000 and 5,200,000 gallons of water annually. Ewe water consumption can be estimated to be between 2,600,000 gallons and 7,800,000 gallons.

Works Cited:
https://www.ag.ndsu.edu/publications/livestock/livestock-water-requirements
https://www.statista.com/statistics/194403/total-number-of-sheep-and-lambs-in-the-us-since-2001/
https://www.investopedia.com/terms/s/sheep.asp

Killer CO2

From our course load and previous scientific course knowledge, we are all aware of some of the dangers that are inherent with carbon dioxide. Our Earth’s ability to absorb and filter carbon dioxide is limited and we cannot afford to depend on our oceans to prevent major change in the world that we know. Reports from the IPCC insist that irreversible temperature changes can be expected during our lifetime with a 1.5 degrees Celsius increase as soon as 2030. Further, the IPCC predicts an increase of 2 degrees Celsius by 2050. This increase would not be extremely noticeable during our daily lives, however experts emphasize that this is not the point. Technology exists that can help to eliminate carbon dioxide before it reaches levels of our atmosphere. This technology is called “negative-emmisions” and they are invaluable for climate goals set by global leaders. These technologies are not enough by themselves, but combined with emission cuts, they would jointly help us towards minimizing climate change. The FUTURE Act, a 2018 federal law, rewards negative-emmisions technologies,

“Nevertheless, there are some bright spots for NETs in the US, Pacala says. For example, a 2018 federal law, the FUTURE Act, provides a $50 tax credit for each metric ton of CO2 that is captured and stored underground. Also, recent changes to the California Low Carbon Fuel Standard program allows greenhouse gas polluters that fail to meet a declining state emission cap to buy emission credits from companies that captured and sequestered CO2. Those emission credits have been trading at $190 per metric ton. Both programs could generate funds for NET development.”

This rewarding of environmentally sound practices is necessary for more global involvement and investment in these technologies. As we discussed in class, large bodies of water, specifically oceans, absorb huge quantities of carbon-dioxide. Wetlands are just as important for their absorption qualities, thus making the need to preserve and protect these areas even more time-conscious. These areas absorb massive amounts of harmful carbon-dioxide, “The plants take in some 840 million t of CO2 each year. The National Academies report estimates this level could more than double in the near future with active restoration and wetland creation, reaching additional cumulative storage of 5.4 billion t of CO2 by 2100.”

Globally we can achieve our goals of minimizing our effect on the planet by preserving natural areas and resources before it is too late.

Works Cited:
https://cen.acs.org/environment/greenhouse-gases/Capturing-carbon-save-us/97/i8
https://joshuacross.com/florida-wetlands-guide/ (image)

Reed Karaska

Hello everyone my name is Reed Karaska and I am a senior majoring in History from Nuangola, Pennsylvania. In my free time I enjoy spending time with my buddies. When I’m outside I enjoy running and fishing. When I’m inside I enjoy playing video games, the guitar, and watching Netflix. I grew up on a small lake in northeastern Pennsylvania and am interested in the applications of sustainability for this reason. I have seen so many different forms of wildlife in and around my home growing up that sustainability and its practice has been a regular thought of mine over the years. I’m looking forward to a great term learning the math behind sustainability with the goal of developing a greater appreciation for it.