Veganism in the UK

In the following charts I will be discussing the recent trends for veganismo before, during, and post-covid. Covid 19, like any other global events, has heightened our awareness on issues surrounding our world and our environment. More people are concern about the health of their loved ones and the health of the planet. when food and toilet paper was sacred, we saw that people were willing to try out alternative options to milk and meat, or whatever they could find in the supermarket.

From the second chart, we can observe that although the number of vegetarian decreased by 0.5 percent from 2019 to 2022, the amount of vegan increased by 2.7 percent. (67 million x 2.7% = one million eight hundred nine thousand) This number is very hopeful in the sense that more people are willing to consume less meat for the sake of the environment. Being a vegan is not easy (I certainly struggle with giving up dairy products), but if a million people can do it, more people will be encouraged to in the future and we can help our environment by a lot. In the first chart we see that 3.3 million of brits live a non-meat lifestyle and I think the US would potentially follow that trend in the future!

Source: https://www.finder.com/uk/uk-diet-trends

2 Charts That Relate to Sustainability

For this Blog assignment, I made 2 charts. The first chart is a scatter plot chart. The second chart is a line chart. I inserted the links to my charts at the bottom because I can’t figure out how to insert the charts on this blog post.

For the first chart, I found that the average family wastes 180 gallons of water per week. I got this from the link below. I took that number and multiplied it by 4 to find out how much they waste in a month. I multiplied the number of gallons wasted in a month and multiplied it by 2 then 3 then 4 all the way up to twelve to see how much water is wasted for each month in a year. My first chart shows how many gallons of water the average family wastes in a year.

https://www.epa.gov/watersense/statistics-and-facts#:~:text=Water%20Stats,gallons%20of%20water%20annually%20nationwide.

For my second chart, I found out how many pounds of food are wasted by the average American in one month. I got this number from the first link below. I multiplied 20 by 1, 2, 3, all the way up to 12 to find the amount of food wasted for each month.

https://www.5280.com/2016/10/how-much-food-are-you-wasting/#:~:text=The%20average%20American%20wastes%20around,wastes%20nine%20pounds%20per%20week.


Chart 1: https://docs.google.com/spreadsheets/d/1-jinw_hxVzHjQrjhTdICHVJsv8g13ahH0ajJmawfEXU/edit?usp=sharing

Chart 2: https://docs.google.com/spreadsheets/d/1qin9nFouNjJ76o2g7SPIu-Onwz_c8ffmmFuWSRN7rSc/edit?usp=sharing

Food Insecurity

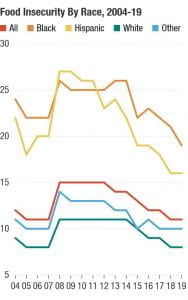
Food insecurity is defined as a household-level economic and social condition of limited or uncertain access to adequate food. This is an unfortunate but prevalent problem in our world and nation today. Data also shows that food insecurity happens in some communities more than others. Specifically, data shows that Black and Hispanic Americans are particularly disproportionately affected. Identifying these inequalities/inadequacies is the first step in attempting to correct/fix them. According to USDA data, 19.1% of Black households and 15.6% of Hispanic households experienced food insecurity in 2019. White Americans fell below the national average, with 7.9% experiencing food insecurity.These percentage statistics portray how common food inadequacies are among Americans and how race plays a role. It is difficult for many of us to imagine not having enough food in our stomachs or worrying about our next meal(s), but that is a sad reality facing Americans. Outside of race, food insecurities appear to be directly affected by level of education and ability to work. College graduates experienced food insecurity at a rate of just 5% last year. For those without a high school degree, the rate skyrocketed to 27%. Adults who have a disability — in particular adults who have a disability and are not in the work force — also experience more than two times the rate of food insecurity as adults who do not have a disability. It is interesting to see how a college degree (and lack thereof one) impact rates of food insecurity. I think it is safe to say that there is a direct link between financial situations and food insecurities based on these statistics, with obtaining a job affecting one’s ability to buy and consume food for themselves and their families. I would be interested to know how common food adequacies are in the state of New York and Schenectady. The graph below shows how food insecurity is affected by race.

Works Cited:
https://www.npr.org/2020/09/27/912486921/food-insecurity-in-the-u-s-by-the-numbers

Food Security

Food security is often something that we as a whole overlook.  Having access to daily meals and other foods is a luxury and a privilege, not a right.  We often think that since we live in such a developed country, with a higher income per capita than a majority of the world that this issue is not that big of a deal, except it is.  According to Feeding America, “In 2020, an estimated 1 in 8 Americans were food insecure, equating to over 38 million Americans, including almost 12 million children”.  This is a staggering number that clearly shows the extent of the effect that it has over our own country.  Another important thing to conceptualize is that there is no one specific group of people who is affected specifically by food insecurity as it “is in every community” according to Feeding America.  Below is a chart that visualizes food insecurity in America.  Food Security in US Households Report 2018 | Census COVID-19 Data Hub As you can clearly see a large portion of America is food secure, but still the slice of people who are not food secure is still incredibly large.


Works Cited:

https://www.google.com/url?sa=i&url=https%3A%2F%2Fcovid19.census.gov%2Fdocuments%2F6cf4af1ff4de4c04ad30001046685636&psig=AOvVaw1RrNohIGekR-rdrlrA23dp&ust=1651605413495000&source=images&cd=vfe&ved=0CAwQjRxqFwoTCNDjwOTDwfcCFQAAAAAdAAAAABAD

https://hungerandhealth.feedingamerica.org/understand-food-insecurity/


The for Profit Prison System

The United States has the largest prison population in the world. Despite being a developed country with countless resources to help the process of rehabilitation, the United States has created a policy of incarcerating people for crimes that many people find to be a problem of our society and not individuals. The war on drugs has been a prime example of this. The US has created a system where non-violent drug offenders can be sentenced to prison for a long time, despite having problems with addiction or mental illness. The problem is that many of the prisons in the United States are private, and designed to make money. When there is such an incentive to have people locked up in order to make money, people who otherwise would not be put in prison, are incarcerated for low-level offenses. This has created a system where people that grow up in low income neighborhoods, that are surrounded by drugs a violence, are extremely susceptible to being put in prison, simply because of the situation that they were born into. We know that people of color are much more likely to be incarcerated for the exact same crimes committed by white people, and this has created and even greater divide in our country.  This for-profit prison system has been one of the main contributors to the racial divide that we have seen in our country.


What's the deal with private prisons? | Jacqui Ford Law | Oklahoma City


Works Cited:

https://fordlawokc.com/whats-the-deal-with-private-prisons/

Necessities during Covid-19

During the Covid 19 virus outbreak, this left many families coping with insecurities such as food, income, and health. With many people losing their jobs due to the worldwide shutdown, this impacted the food insecurity issue. Without jobs there was not a constant income coming into families homes that they could use for necessities such as food. The impact of Covid 19 on food security has a common theme of different races being differently affected. As presented in the chart below, it depicts the food insecurities by race with a variable of whether the family had children or overall. As we can see, the black and hispanic race was much more affected by Covid 19 in relation to food security. This chart was found in a study on whether the families had thought about food in the last seven days. The black communities suffered from Covid 19 food insecurity most prominently as shown in the chart at 23%. Whereas the Asians and White race were suffering less but it also depicts how all races had been affected by food insecurities during Covid. As the United States recovers from the pandemic, society must intend to help the families in need whether that’s through governmental funding or radical changes such as access to food banks and pantries. Although food insecurities is a major suffrage of Covid, there are several other social justice issues that the American society is working toward. Charts like the one below can visually present the effects Covid has had, and there are many other charts for other social justice issues.

References:

https://econofact.org/who-does-not-have-enough-to-eat-in-america

Race Wealth Gap and Gentrification

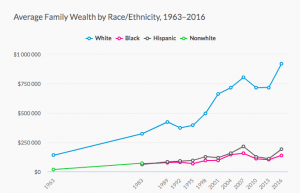
For this blag post I wanted to focus on something that I have previous knowledge about and that is in part to my Political Science background as a Union College student. Much of the focused in my classes has been on race segregation as well as housing political segregation among races. Gentrification, which is the forceful removal of residents out of their homes in Urban area is what I will discuss in this blog. Much of gentrification is based upon the the wage gap of race in the United States. Here is a graph depicting the wage gap between Black and White Americans..

.

As you can see very clearly by this line chart, there is quite the disparity between the average wages between black and white families. Coinciding with this wage gap, is the demographic of people who live in inner city areas which is where gentrification is most prominent. It is on average that 30% of inner city populations is made up of Black citizens. While this is less than the white community, the population of African Americans in the United States is only 13%. Of black people, there is a greater percentage living in inner city, gentrified areas than there is the percentage of white people. Everything in the US’s economy works around the capitalist society that our country was built upon. African Americans make less money on average and are faced with more severe challenges in urban areas than the white urban population is facing.


The Superyacht Phenomenon

The superyacht is a phenomenon that has emerged in recent times. While building large yachts became a trend in the early to mid 20th century, owning a superyacht hasn’t really been a trend up until now. As wealth disparities and class divides continues to grow, the rich grow from rich to super rich, allowing them to buy things like superyachts that they previously could not. The chart below shows the growing number of superyacht projects, and how the vast majority of these projects end up being motor style, a more commercial style accessible only to the super rich.

2020 Global Order Book

The most egregious example of this is Jeff Bezos’ custom superyacht, Y721, which he commissioned in 2018 for $500 million from the Dutch company Oceanco, and was recently completed. The specs on the superyacht illuminate the vast wealth Bezos has to throw away: “This support ship measures 246 feet in length and accommodates 45 additional crew and guests. It will also feature a helipad and meeting space and have a vast amount of storage for Bezos’s endless number of water toys, with diving and snorkeling gear, jet and water skis, waterslides, and surfboards among the bunch.”

The average superyacht costs $275 million. If we assume that out of the 619 motor superyachts were average superyachts, around $275 million each, then the cost of all those superyachts and Bezos’ would total $155,250,000,000. With that kind of money, the U.N.’s plan for Elon Musk to end world hunger could be completed almost 26 times. That cost could cover a little over 1/2 the lower estimate to end climate change, and that is only for the money spent on purchasing motor superyachts in 2020. Over 2 or even 3 years? The money would definitely cover the lowest estimate, and then some.

Just something to think about when we see reports of Leonardo DiCaprio, the U.N.’s “Messenger for Peace for Climate Change” riding around in a superyacht.


SOURCES:

https://www.forbes.com/sites/aliciaadamczyk/2015/04/08/how-much-does-a-superyacht-really-cost/?sh=718973bf36bc

https://www.boatinternational.com/yacht-market-intelligence/luxury-yachts-on-order/2020-global-order-book–42403

https://www.mynewsdesk.com/us/brandessence/pressreleases/superyacht-market-statistics-2021-industry-analysis-3072167

https://www.bbc.com/news/world-us-canada-57079327

https://12ft.io/proxy?q=https%3A%2F%2Fwww.architecturaldigest.com%2Fstory%2Fbezos-mega-yacht

https://www.globalgiving.org/learn/cost-to-end-climate-change/

Food Insecurity in the U.S.

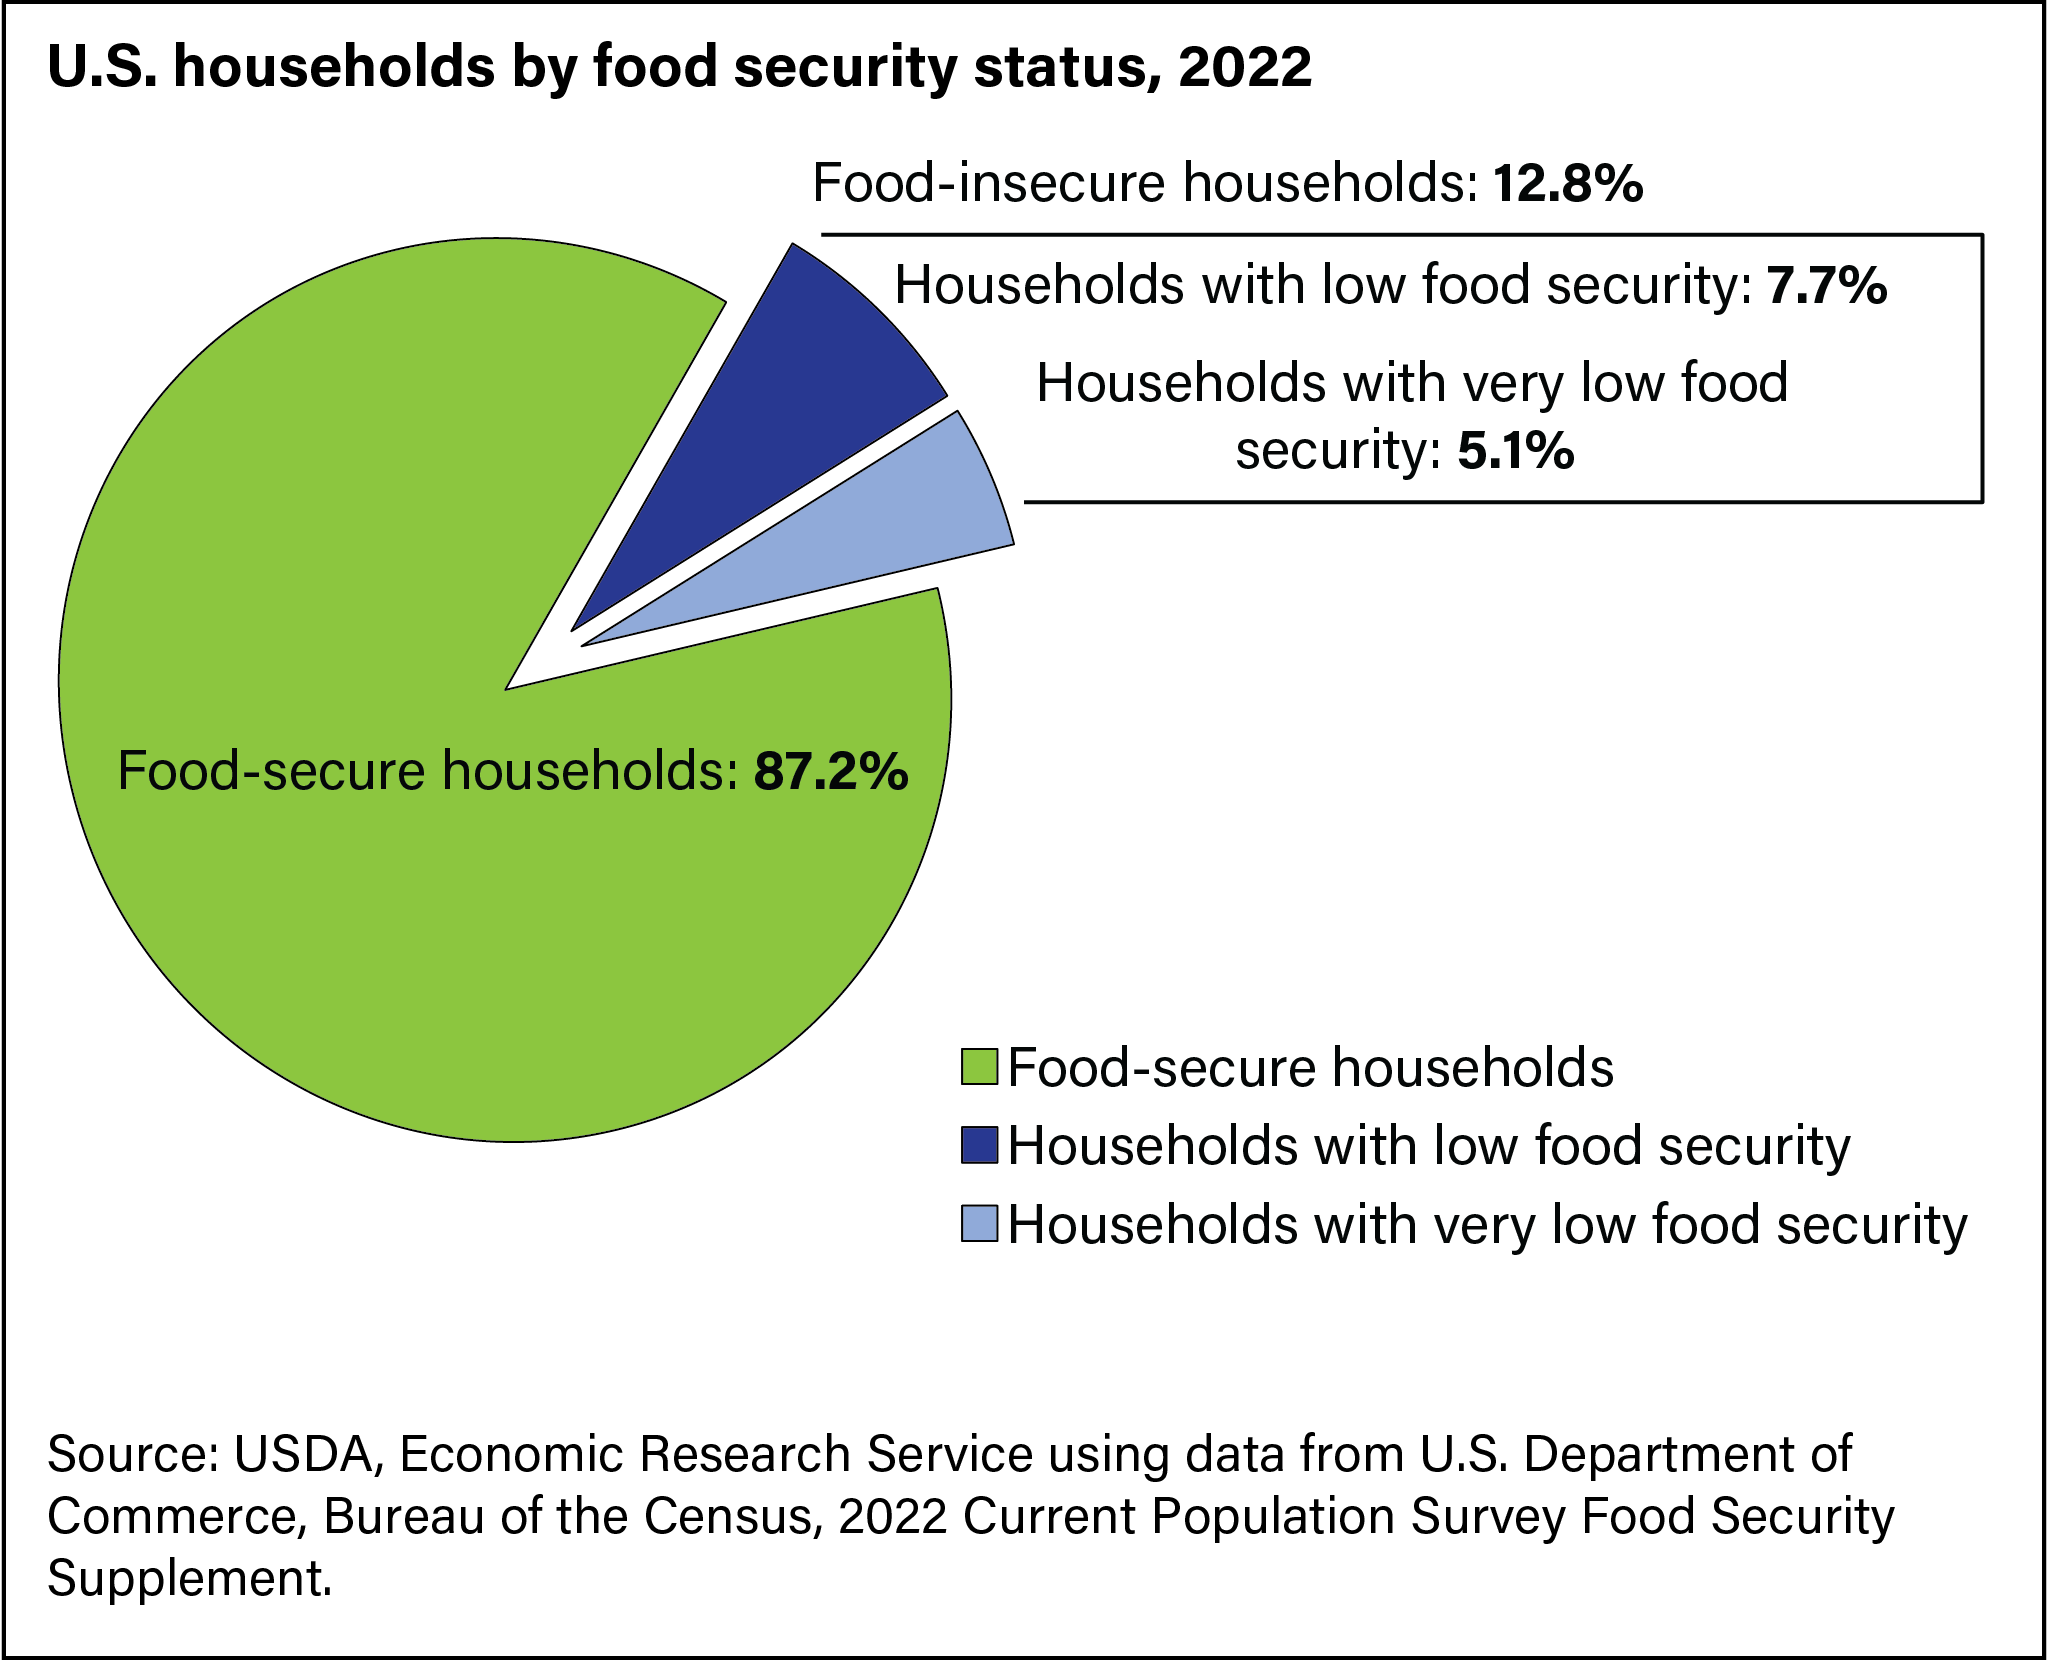
The issue of food insecurity is one that is very prevalent in the United States.  Food insecurity, according to the USDA, can be defined in different ranges; either low food security or very low food insecurity. Low food security is when the quality or variety of one’s diet is undesirable, with not much, if any, reduced food intake.  Very low food security is different from low food security in that reports of reduced food intake are made as well as the issues that are seen in low food security.  Food is something that those who have never faced food insecurity often take for granted, however, for people who have faced it, it is a major issue, while affecting different groups of people in the United States disproportionately.  As seen in the graph below, 10.5 percent of U.S. households in 2020 were food insecure and, of these households, 6.6% had low food security and 3.9% had very low food security.

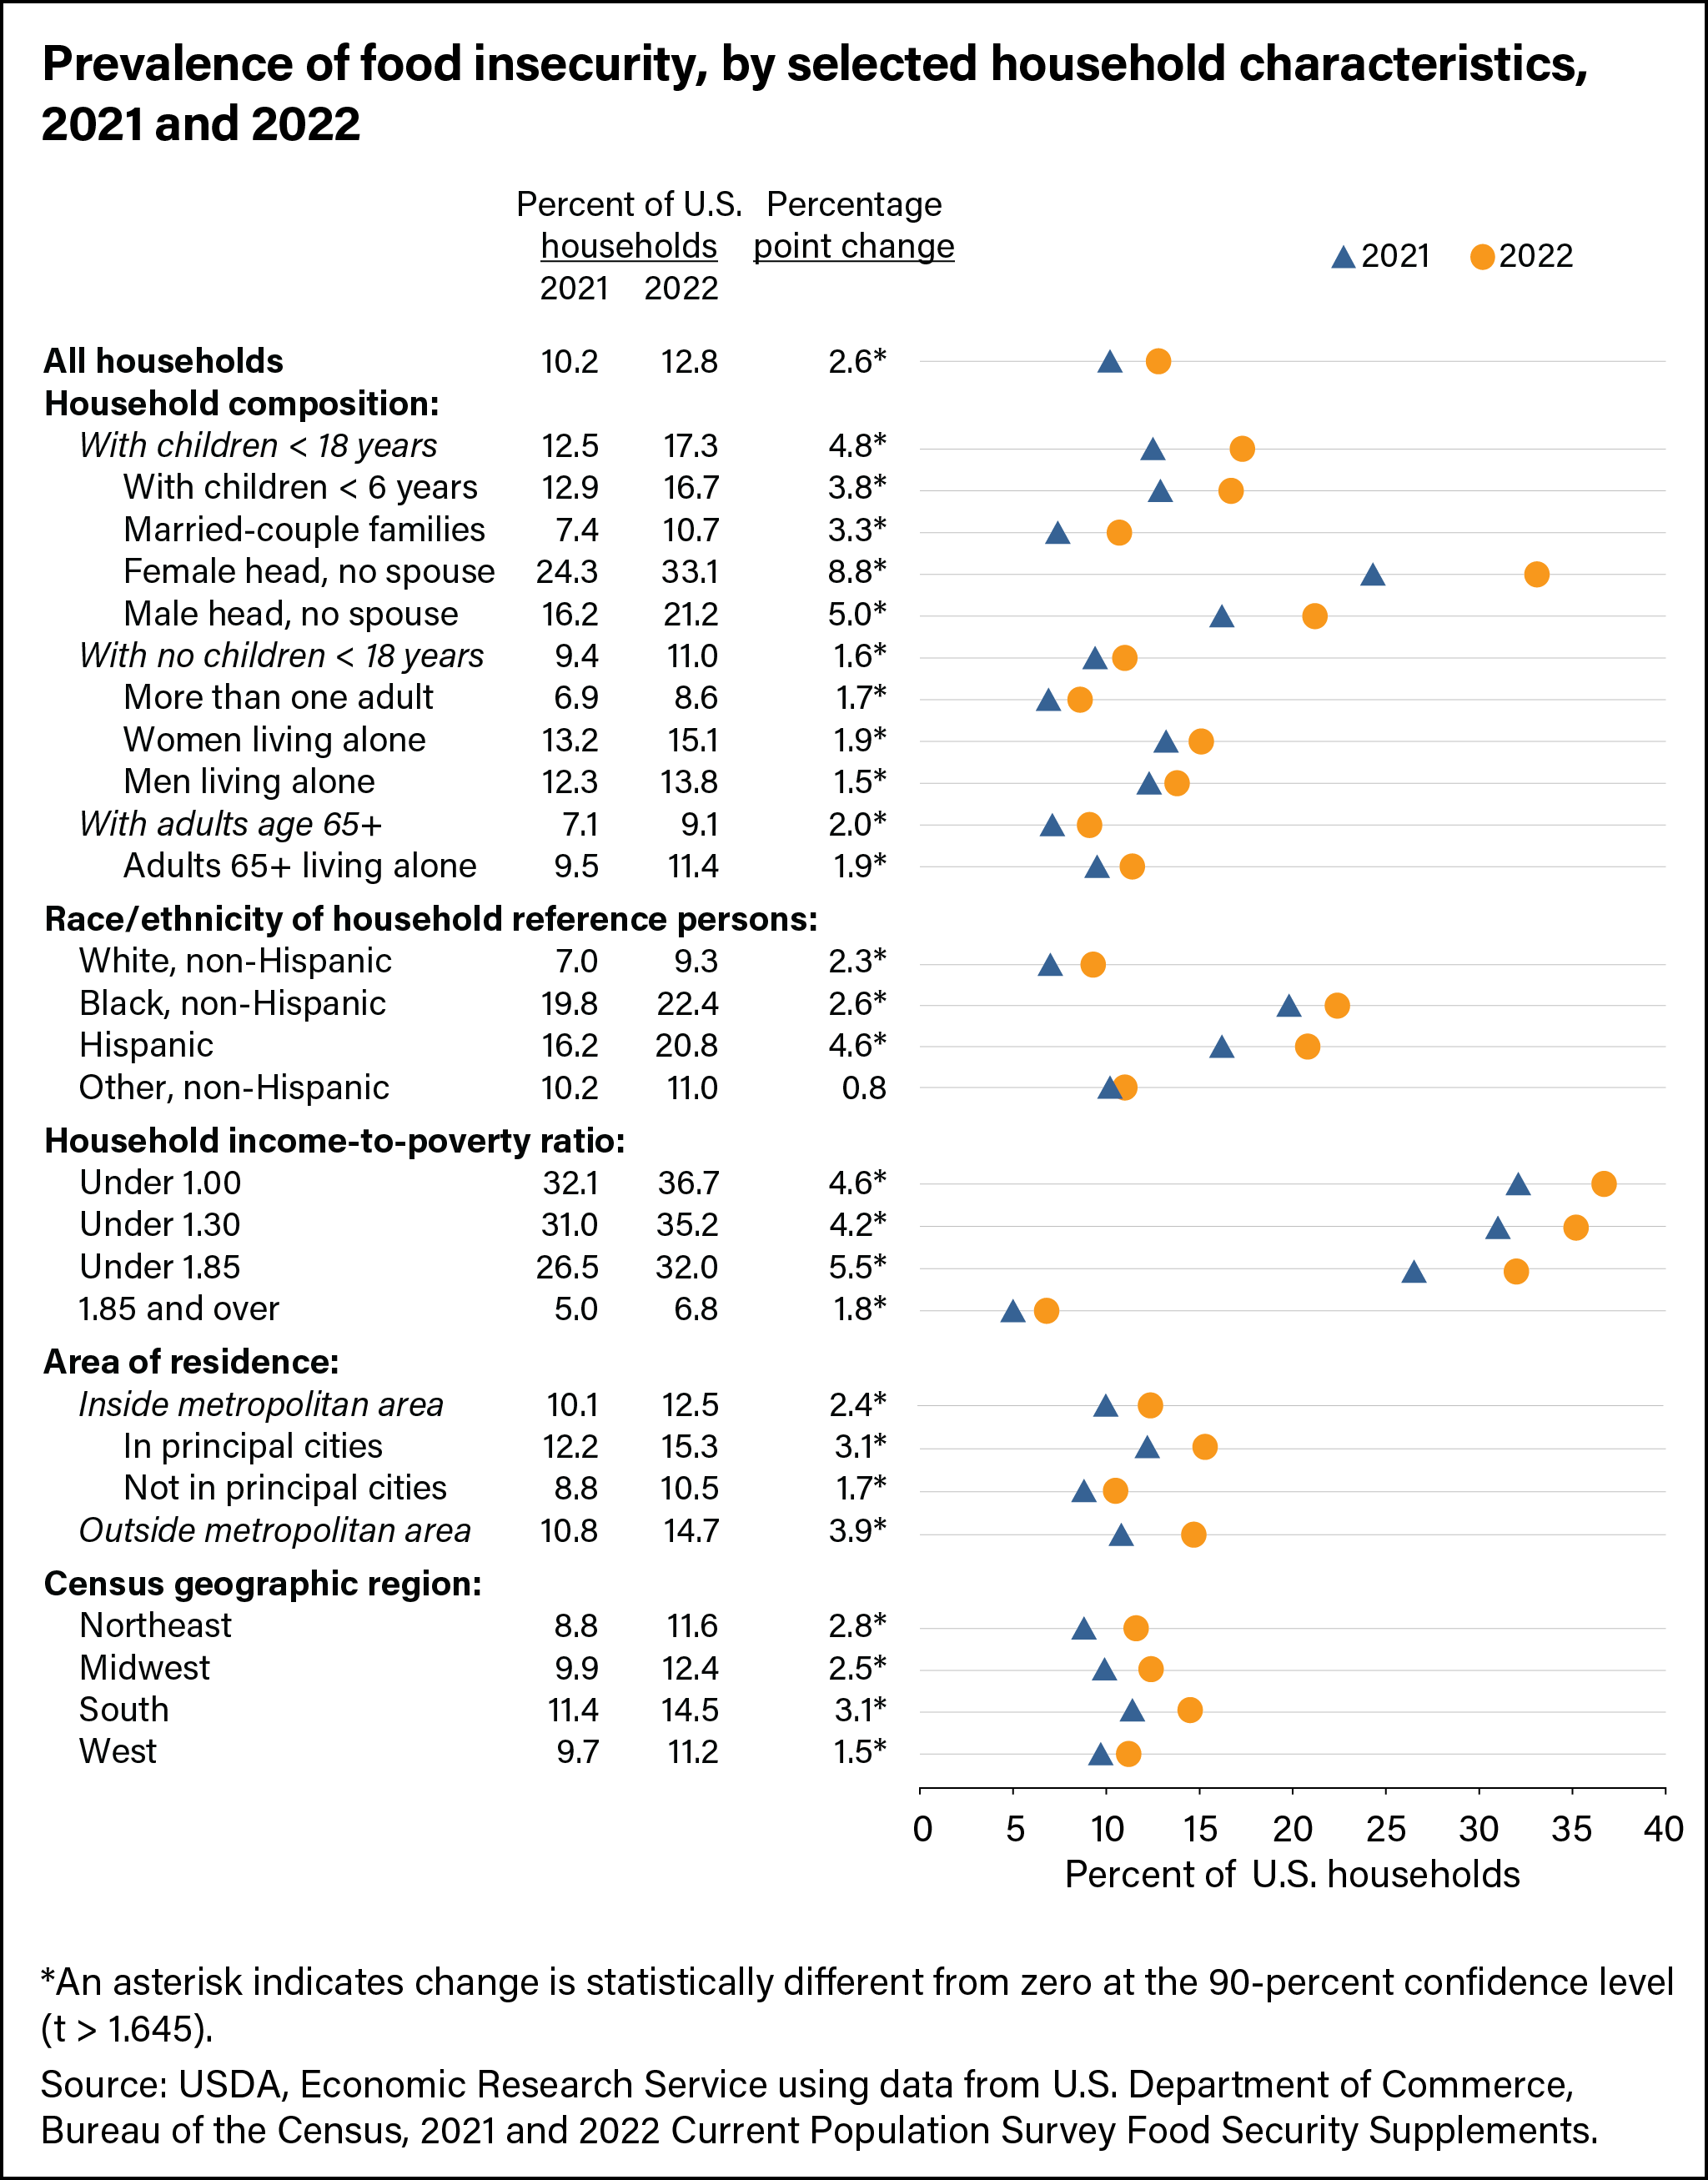
However, as I mentioned before, different households were more likely to have experienced food insecurity than others in the United States.  For instance, as seen in the graph below, rates of food insecurity were much higher in Black (21.7%)  and Hispanic (17.2%) households, showing how food insecurities disproportionately affect people of different races in the U.S.  Households helmed by a single woman with children were also much more likely to become food insecure, with 27.7% of them being food insecure.

Nutrition is a major factor into one’s health and those who are food insecure are less likely to have the nutrition one needs to live happy, healthy lives.  Until food insecurity for everyone is solved in the United States without the disparities in different groups as seen above, food security and insecurity will remain a major contributing factor to health problems for many in the U.S.


https://www.ers.usda.gov/topics/food-nutrition-assistance/food-security-in-the-u-s/key-statistics-graphics/

Social problems of a greater magnitude

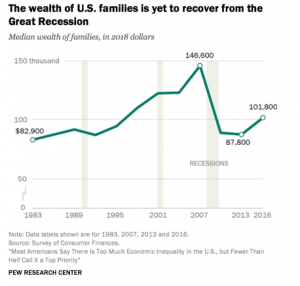
The social problems described in my classmates’ posts ranging from but not limited to food insecurity, US incarceration rates, and unequal access to education may be a symptom of an arguably widening and bigger issue in the US not unrelated to sustainability and social justice topics. According to a Pew Research study published in February ’22, since 2007 earnings for middling workers in the US have remained stagnant while in that same time frame the wealth of upper-income families has exploded by about $200,000 give or take measured in 2018 median dollars. Simply put income inequality in the US is widening and one hedge fund worker and now author Kathy O’Neil in her book Weapons of Math Destruction argues that as we progress into the information age technology can produce some potential negative externalities for low-income people one of them being an over-policing of low-income neighborhoods. This tendency increases the initial chance of people living in these communities ending up in jail for first-time offenses, but she also adds that the recidivism rate, that is the tendency to go back, increases too. Additionally, these are the same communities that often face food insecurity, unstable employment, and unequal access to education at least from a statistical standpoint and perhaps sometimes a very real standpoint in the aggregate. I think from this standpoint we can ask ourselves what types of opportunities does technology offer us middle-class folk that we can use to increase the overall value of our society from top to bottom(monetary, agriculturally, etc.), and what necessary but difficult changes must we adopt to prevent divisive ideologies from distracting from the main focus of our society’s goal to survive and thrive.