Solar power and its feasibility

To begin with, the pursuit of sustainable energy is something that not many countries are able to afford. Developing countries have a much harder time becoming more sustainable due to cost of these renewable energy. But to tailor this more specifically to the solar power, it is a relatively expensive renewable energy. According to U.S. DOE’s Energy Information Administration (EIA) ¨it’s the most expensive form of electricity among current technologies for new electricity generation, about $396 per megawatthour for PV.¨ It is roughly twice the amount of other energy such as wind. Therefore, commercial-level application is probably very difficult. On campus, the only housing that had the solar power is the Garnett, and it is not even enough to sustain the energy that runs in the building. However, it should be a goal to strive towards, especially for the US as a developed nation!

Source:

https://www.nationalgeographic.com/science/article/101105-cost-of-solar-energ


No more Sweltering with Solar Power!

When it comes to being sustainable, it’s important to use renewable energy in terms of specific situations such as air pollution and reducing greenhouse gas emissions in fossil fuels.  For instance, I want to talk about instead of using electrical heaters, the usage of of solar thermal heating.  With solar thermal heating there is a 60% less energy used to heat water, and 35% less energy is used for spaced heating,  so already there is conservation of energy when it comes to renewable energy vs. fossil fuels.  Economically, there is a Lower purchase price when using solar thermal heating systems, and cost less when it comes to reparations and maintenance.  There are two options when it comes to solar collectors.  There are flat plate collectors and evacuated tube collectors, with the only major difference being flat plate collectors using insulation material such as rock wool or polyurethane.  Flat Panel collectors are quite a common purchase in southern climates, while evacuated tube collectors are more useful for winter temperatures where it drops at 40 degrees fahrenheit or lower, with the tubes retaining a high percentage of heat.  Solar heating in general is reliable and flexible, working well with a heat pump or pellet heating.  Overall, if you’re looking for a heating system option that has no CO2 operations when in use, consider replacing  your electrical heating system with solar thermal heating!


references:

https://www.vaillant.com/what-we-do/technologies-to-make-people-feel-good/how-different-technologies-work/solar-thermal-heating/

http://www.solarpanelsplus.com/all-about-solar/evacuated-tubes-or-flat-plates/


Impact of “Meatless Monday”

I asked my friends how many days a week they eat a meal that includes meat. I wanted to ask this question because I’ve been a vegetarian for about 10 years, so it was interesting to compare the impact my friends’ eating habits to mine. A lot of initiatives have done research that shows eating vegetarian for just one day a week can reduce the impact that the meat industry has on global warming. For example, the Meatless Monday campaign states that eating less meat “can help reduce the incidence of chronic preventable diseases, preserve precious land and water resources, and combat climate change.” As you can see in the column chart above, Laura and Keerthi have the most sustainable impact with only 5 non-vegetarian meals per week.


About Meatless Monday

Tidal Power, the future of energy!

As the threat of climate change grows each year, the need to harness renewable energy sources becomes more and more important. There has been much focus on harnessing wind and solar energy, but a lack of focus on the possibilities created by the ocean. Recent research explores the many ways to harness energy from the ocean, and its potential to be a reliable source of electrical energy that has the capacity to power thousands of households (Bahaj 2011). The unique dependability of tidal power is due to the Earth’s stable tide schedules; this is unlike wind and solar power generation, which is powered by unpredictable sources (Mackie et al. 2021). Tidal power farms have the potential to harness over 500 MW of energy, yet the scientific world has only just begun to research these large-scale projects (Yang et al. 2021). This lack of research is likely due to the need for the development of new technologies and proper funding to understand how these projects could be implemented on a more global scale. As of right now, many tidal power stations are battling ocean bed erosion caused by the strong flow of the turbine (Kim et al. 2021). With more research and development of technologies, the ecological and environmental damages can be limited, and in the end so much better than burning fossil fuels.  Currently, there are only a handful of large-scale farms, namely La Rance Tidal Power Station in France and Shihwa Tidal Power Plant in South Korea. In the South Korean plant, it has the capacity to power around 500,000 households along with having many positive environmental effects on the artificial lake in which it is based, such as reducing the levels of carbon dioxide in the water and revitalizing marine life in the surrounding area (Park and Lee 2021). Since the majority of our earth is covered in water, tidal energy once developed could be a reliable source of energy without using fossil fuels. 


Bahaj, A. S. (2011). Generating electricity from the oceans. Renewable and Sustainable Energy Reviews, 15(7), 3399-3416.
Kim, J. W., Woo, S. B., Song, J. I., & Kwon, H. K. (2022). An observational study of hydrodynamic impact on water mass transport due to tidal power generation. Science of The Total Environment, 807, 151013.
Yang, Z., Ren, Z., Li, Z., Xu, Y., Li, H., Li, W., & Hu, X. (2022). A comprehensive analysis method for levelized cost of energy in tidal current power generation farms. Renewable Energy, 182, 982-991.

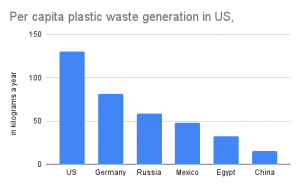
Per capita plastic waste generation in US, Germany, Russia, Mexico, Egypt, China in 2016

The graph that I have chosen to use is the data I found from Statista about plastic consumption in 2016. The data set included countries from over 20 countries, but I decided to pick 6 of the countries, ranging from levels of GDP, environmental awareness, and natural resources, etc. Unsurprisingly, the US ranked number one, which is 5 times of what china has. In today’s climate, the US made the public seem like other countries are doing way more harm to the environment than us ourselves, and this chart is really telling in terms of our contribution to environmental degradation.

On the other hand, I realised that GDP doesn’t necessarily reflect the consumption for plastic. according to Voanews, china accumulated 15.92 GDP vs the United States 23 GDP, however, the US uses 5 times more plastics than China. Therefore, environmental awareness is necessary regardless of level of GDP.

https://www.statista.com/statistics/1228043/plastic-waste-generation-per-capita-in-select-countries/

https://www.voanews.com/a/chinas-economy-could-overtake-us-economy-by-2030/6380892.html

Water usage from highly populated Countries in 2017

Water Usage by Country in 2017 per billions


When looking at water usage for highly dense countries, this pie graph shows the percentage use of water by each country.  However, I personally thought that water usage was mostly coming from showers, however with laundry, brushing your teeth, washing your hands and doing dishes contributes to how much water we use per day.  Surprisingly China had the highest amount using around 591.8 billion gallons in all of 2017.  I personally thought that the US would have used way more water usage, but when coming to terms with the population of China compared to the population of the United States, its no surprise that they are about 2 times larger when it comes to the US using 444.4 billion.  However, 2017 was about 5 years ago, and scientists have said that water usage has increased.  If there’s a continue increase of water usage in 5 years from now, who knows the results it will have for the irreversible effects of climate change.

resources:

https://ourworldindata.org/water-use-stress


Greenhouse Gas Emissions Globally

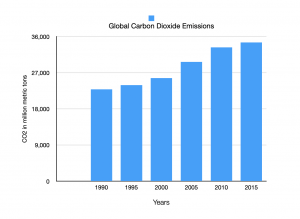
Climate change and the long term effects that come with it is something that most people agree is an issue that needs to be combated.  The global temperature increase is mainly caused by human activities, which produce gasses that trap heat in our atmosphere.  These greenhouse gasses have increased from human activity, and, as seen by my graphs below, are still increasing, furthering climate change.  When most people think of a greenhouse gas, they think of carbon dioxide being emitted into the atmosphere.  As seen below, between 1990 and 2015, the net emissions of carbon dioxide increased by 51% globally.  This is a real issue, as three-fourths of total global emissions come from carbon dioxide, so it is a major contributor to global warming.  Carbon dioxide was not the only greenhouse gas that has increased globally; as seen below, methane increased as well.  Methane was actually the gas in the data set that increased the least, only 17%, but as you can see from the graph, even the gas that increased the least still consistently increased in recent years.  Other gasses that are not pictured in the graphs but increased include nitrous oxide and fluorinated gasses.  No matter how you look at it, the way these greenhouse gasses have consistently increased globally is a sign we need to make real changes to combat this issue before it gets even more out of hand.

Shower Length and Water Waste

An issue that directly connects to sustainability is water waste. The way I aim to measure water waste in daily life is through how long it takes my friends to shower. Showering is one of the easiest ways to waste large quantities of water because of the constantly flowing stream of water. I asked many of my friends how long on average that they shower for in order to evaluate how much water they waste. Based on their answers and the data I gathered, my friends spend on average 21.8 minutes in the shower. The shortest time recorded is 5 minutes and the longest time is on average 45 minutes. The average flow rate of a shower head is 2.1 gallons per minute. This indicates that on average my friends waste 45.78 gallons of water per shower. My friends that take showers on the longer side, 30-45 mins can take shorter showers to reduce their personal water waste and become more sustainable. Every minute makes a difference and adds up over time.

Gasoline prices and population in New York City Boroughs

Gasoline prices per borough

This graph displays the gas prices in 3 boroughs in New York city per gallon.  All three boroughs have a similar range but the trend shows that Bronx has the highest price in gas despite having the lowest population. The effect of having to pay more for gasoline despite being the lowest populated. support the idea that both boroughs nearby spend less money on gas therefore may be marginally richer to spend on other things.

References:https://www.numbeo.com/gas-prices/in/Bronx


Weekly Seatbelt Time

This week I decided to involve some of my friends in an investigation into roughly how long Union students spend in a car weekly. I decided to ask the simple question, “How long, roughly, do you think you spend in a car per week?” and recorded the responses I received. The data represents the amount of minutes a handful of Union students spend weekly in a car. The data reflects 50% of those interviewed spend 30 minutes or less in a car weekly and 50% spend more than 30 minutes in a car weekly. I was pleasantly surprised to find that all individuals I interviewed spent under an hour in a car on-average, which is limiting their carbon footprint on the environment when they are at school. The data is possibly a reflection of the small size of Union contributing to students choosing to walk distances instead of driving them. The warmer weather we are experiencing may also be contributing to this data.