Ryan Hayes’ senior thesis was inspired by the Business Breakdown podcast series, so we decided to do a podcast ourselves. You can listen to it below – learn about the initiation coverage report (0:50), what Global Foundries does (2:00), the kind of chip...
I love trailers. Coming attractions is my favorite part of going to the movies. I wanted to see what combining spoken word, images and music would look like for a course. Below is the...
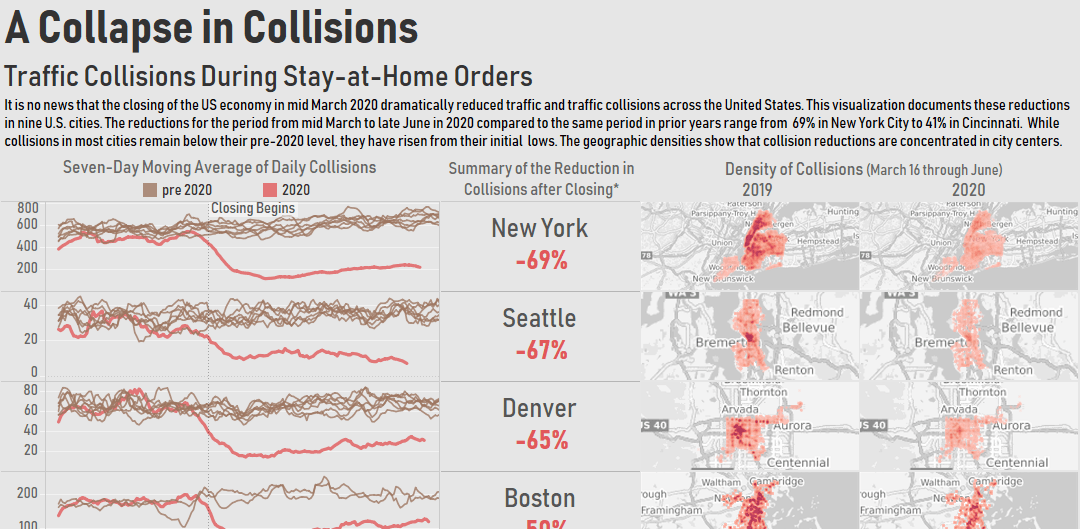
A polished Tableau viz showing the collapse in traffic collisions during stay-at-home orders. You can download the Tableau workbook here, read the accompanying article on Medium.com here, code and data here. You can download the Tableau workbook here, accompanying...
I have been a platinum member of Audible.com for the last decade or so. This means that for $240 I get 24 audio books per year. I listen to them when I run, mow the lawn, and on long drives. The average audiobook is about 9 hours, so an hour-long run, four or five...
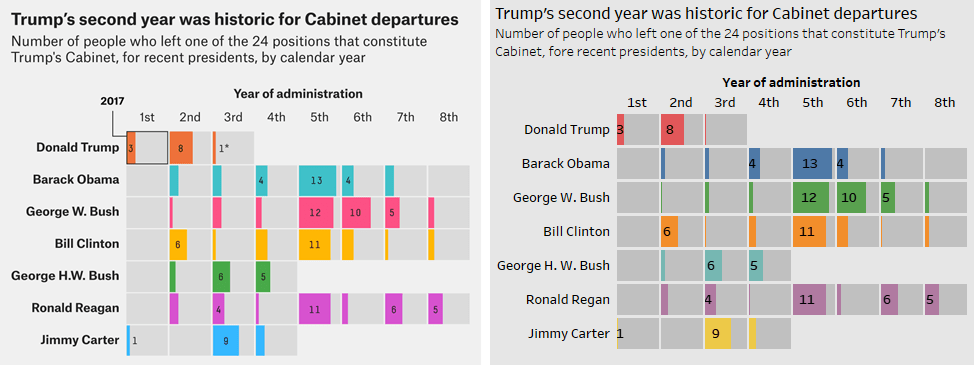
Showing cabinet departures for recent presidents was one of 56 “best and weirdest” charts of FiveThirtyEight in 2019. I asked my students to replicate the chart in Tableau. See if you can tell which of the above images is the FiveThirtyEight chart, and...
In 2007, I published the Sample Annotated Paper in Econometrics in the Journal of Economic Education (JEE). That paper illustrated the structure of an econometrics paper: sections, presentation of descriptive statistics, results etc. Recently, a couple of colleagues...
Train, validate and test partitions for out-of-time performance take planning and thought (This piece is also at TDS.) The purpose of supervised machine learning is to classify unlabeled data. We want algorithms to tell us whether a borrower will default, a customer...
A target date fund (TDF) is a sensible and increasingly common choice for retirement saving. My own employer, Union College, relies on Fidelity or TIAA TDFs as the default investment option. I was therefore curious to investigate recent reports that Fidelity is...
Tableau’s LOD expressions are extremely powerful. They allow users to control how Tableau aggregates data. This is particularly important when we join tables with different level of aggregation. For example, combining transaction level data with store level data...