Recognizing the Gender Wage Gap

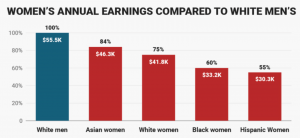
The gender wage gap is something that lawmakers have tried to address through legislation, such as the Equal Pay Act, however it is still a very prevalent problem in America. Today, a woman earns about 79 cents for every dollar that a man earns. This is clearly unfair and shows that gender discrimination is still impacting individuals despite the progress and the attempts to close this wage gap. Women of color specifically earn the least when compared to the wages of men and white women. This may be due to the intersectionality of the identities of women of color (including gender and race), further proving that race and gender are factors that unfairly impact earnings. For example, Hispanic women earn only 55% of the earnings of men. This large gender wage gap is a clear example of unequal treatment based on gender in today’s society. It has been predicted that the gender wage gap will hopefully be closed by 2059. While this is great, the current wage gap (as shown in the following bar charts) is something that is actively impacting every woman and marginalized identity group right now without a quick fix to refocus professional earnings on talent rather than gender.

citations: https://www.weforum.org/agenda/2017/03/these-5-charts-show-how-big-the-pay-gap-is-between-men-and-women/

US incarceration rates in 2010

This bar chart explains US incarceration rates based on race and ethnicity from 2010. It shows that blacks are disproportionately imprisoned as compared to all other races. It shows that black individuals are over five times more likely to be incarceration than white individuals. It also shows that American Indian or Alaskan Native are the second most commonly incarcerated ethnicities which is somewhat surprising to me because I feel like this population is so commonly overlooked in research and most commonly put into an “other” category. Often statistics and research leaves them out and only chooses to include Latinx, Black, Asian, and White groups in their research so it is interesting to understand the racial profiling and potential targeting that leads to incarceration that American Indians and Alaskan Natives are subject to as well. This goes for Native Hawaiian and Pacific Islanders as well, coming in as the third most commonly incarcerated ethnicity in 2010. Higher incarceration rates of people of color is indicative of many social justice issues in the US. Such as being indicative of issues regarding over policing minority and lower income communities as well as issues of racial profiling. Racial profiling issues can be  connected back to the war on drugs period in American history in which minority populations and people of color were tied to drug scares and labeled as dangerous criminals. Unfortunately, the implications of this war on drugs still exists today and can be seen in greater incarceration rates of people of color in the US.

Unequal Access to Education

Every child has a right to an education, however millions across the globe do not have access to education (this is not to mention the children who do have access to a low quality education). According to 2012 numbers, 120 million children were not enrolled in elementary school or middles school, with 50 million of those children living in Sub-Saharan Africa. Education is the key to improving communities and societies, without it, poverty lines increase and social mobility becomes harder. The chart below shows the number of children not enrolled in elementary of middle school in the year 2000 compared to the year 2012 across the world. The green bars indicate female children not enrolled in school while the blue bars represent male children not enrolled in school. As you can see, it is more common for girls to not be enrolled in school than it is for boys, which is another social injustice. More work needs to be done to ensure that children have access to quality education!

https://www.statista.com/chart/3180/out-of-school-children/

Are rising temperatures dramatically effect people of color?

Environmental racism is a concept that often gets overlooked however it’s a big issue that is connected to many aspects of society. One way that you can look at this is through climate change and the demographics of where people live. According to NPR, in a study of 108 urban areas nationwide, the formerly redlined neighborhoods in nearly every city studied were hotter than those not subjected to redlining. The temperature difference in some areas was nearly 13 degrees. There has been a systematic disparity on who is getting affected by climate change the most. If you look at a global level “counties with large African American populations are exposed to extreme temperatures 2 to 3 more days per year than those counties with smaller African American populations.” In the next decades, this trend is only going to increase. If you look at the graph below it shows the different emission paths and the number of unlivable months out of a year a place will experience because of heat. This graph shows the many places that will become unlivable, with the ones most affected being around the equator which in many places has a high percentage of people of color. With temperature increase and the creation of unlivable zones will trigger a series of mass migrations which is both a social and humanitarian crisis that should be important to everyone.


.


Income Inequality in America

Income inequities have always been around in the United States. Yet, over the past few decades the gap has grown. As seen in the pie charts you can see that since 1989 the top ten percent of income earners have grown 8% totaling a total 50% of all of the income in the United states. In 2016 the bottom 50% of income earners made between $0-53,000, the middle 50%-90% made between $53,000-$176,000, and the top ten percent make over $176,000 people.  The inequities are clear. What the chart doesn’t show is what percent of the wealth that the 1% have. According to Smart Asset, a personal finance website, the 1% makes nearly $600,000 a year, which shows that there is are huge inequalities among the top 10%.

https://www.stlouisfed.org/open-vault/2019/august/wealth-inequality-in-america-facts-figures

https://www.cnbc.com/amp/2022/01/24/how-much-money-you-have-to-earn-to-be-in-the-top-1percent-in-every-us-state.html

Food Insecurity- Issue of Equity

As a Sociology major, looking at the ways in which different social justice issues affect individuals isn’t new to me. However, what is new to me is looking at these issues through a mathematical lens. The issue of food insecurity and hunger is not just an issue surrounding food, but an issue surrounding equity. Consider the following chart;

The information on this chart shows that the rate of White college students facing food insecurity is 36%, which is quite high. However, other demographics have even higher percentages. Hispanic college students food insecurity rate is 47%, Black is college students rate is 54% and Indigenous college students rate is 60%. This data shows that food insecurity is an issue of racial equality and equity.

One of the main contributing factors to the difference of food insecurity among demographics is the difference in pay wages. Consider another chart below;

This chart displays that no matter the level of education, White employees will be paid more than Black and Hispanic workers. When an individual is paid more, they have more access to purchase food and avoid food insecurity. Hence, White workers being paid more definitely contributes to White individuals having the lowest rate of food insecurity among college students, compared to Black, Indigenous and Hispanic college students.

Lastly, as we have previously discussed, healthier food options are more expensive than unhealthy food options, such as fast food chains (McDonald’s, Burger King, Wendy’s, etc). With this in mind, families of lower income are going to be more likely to eat at fast food restaurants given the low prices. Consider this last data set;

This data shows that the rate of obesity among White students is only 29.3% while it is 35.9% among Black children and 38.2% among Hispanic children. This makes sense given everything that has been discussed thus far in this blog. Eating cheap fast food more often will result in higher obesity rates. The way that poverty can have an affect on so many other factors such as physical and mental health displays how capitalistic our society truly is.

Racial Disparities Amongst Youth in the US Prison Systems

There is a huge disparity in the disproportionate amount of African Americans that are incarcerated each year in the United States. This has been a long withstanding issue in America, but the issue itself has gained a lot of media attention, especially in recent years, due to current events that have taken place within the past five years or so. The staggering gap between racial identities that face imprisonment is alarming, and when applied with qualitative data, it becomes even more appalling.

This post is from the Census Bureau, and is as recent as 2019. It is a comparison between the percent that youth under that age of 18 from different racial demographics make up in the larger population compared with their respective incarceration rates. White youth make up approximately 72% of the population living in the United States (under the age of 18), and are 62% of juvenile imprisonments. There is a 10% buffer there. Hispanic youth/youth of other races account for around a quarter of the population under the age of 18, and make up 23% of juvenile imprisonments. Comparatively, black youth make up just 15% of their age pool, but are a whopping 35% percent of underage imprisonments/arrests. They account for 20% more of imprisonments than they do in comparison to their percentage of the populationThis is a staggering statistic, and speaks to the immense issue that is present with respect to racial disparities and the prison system. And this is just in regards to kids under the age of 18.

Sources cited:

https://www.prisonpolicy.org/blog/2020/07/27/disparities/

Hospitalizations among different socioeconomic classes

Hospitalization has a solid connection to one’s socioeconomic status. Typically lower-class individuals are hospitalized more since preventative treatments are less available. This also translates to healthcare. Many non-salary jobs do not provide benefits such as healthcare which means one is on their own. Not having healthcare severely limits medical treatments. The attached collum graph shows the “number of potentially preventable hospitalizations” (CDC). The dark blue indicates the expected hosl[pitalizations which are equal amongst all classes. However, the excess hospitalizations (light blue) increase amongst the lower classes. This would suggest that the lack of healthcare and preventative treatments results in excess hospitalizations.

ESG Scores

I had never heard of an ESG score in my life. An ESG score stands for Environmental, Social, and Governance score. These are ratings that measure a company’s exposure to environmental, social, and governance risks. These risks include worker safety, energy efficiency, and board independence and all of these have financial implications. ESG scores/ratings can influence investors and may sway them for or against a specific company. What is interesting is that recent studies are showing that a 10 percent increase in corporate disclosure is associated with a 1.3 to 2 percent increase in ESG score variation among major ratings providers, which all interpret and process disclosures differently. More importantly, they are showing that the more information a company discloses about its ESG practices, the more rating agencies disagree on how well that company is performing along these dimensions. By being transparent about their ESG scores, companies are actually disadvantaging themselves! This seems contradictory but that is why the latest research is shocking. These companies have a lot to lose with more than $30 trillion in sustainable investment capital on the line…Investors are dumping massive savings into companies they believe will help provide sustainable futures, so if their transparency is allowing the rating agencies to hurt the company, then the investors will hurt financially as well. If these investors pull out on their investments, many promising companies looking to change the world by preaching sustainability may go out of existence. This newest research raises questions on the effectiveness of the rating system and if the rating agencies need further regulation. I think most people would agree that all companies and corporations in the United States need some oversight to make sure they are not harming the environment, but maybe the rating agencies need additional oversight as well.

Electric Vehicles; a deeper look!

The man that we all know, who just recently bought Twitter, Elon Musk, has paved a positive progression of sustainable growth with the success Tesla has found and its push for others to drive sustainable with electric vehicles. There is a lot more to electric vehicles than what many may assume. Yes, of course you are not using gas which we all know comes at a great expense and produces negative exhaust into our atmosphere but there are tons of trickle down effects too that EV cars are preventing. The carbon footprint of EV cars is much smaller than gas powered and this also applies to buses and other forms of transportation that are going electric. As we see in many charts and graphs, the largest carbon footprints come from transportation. With EV trucks, as well as cars, it is not just individual human transportation that can create a smaller carbon footprint. The transportation of goods in larger trucks is a huge beneficiary of promoting shrinkage of our carbon footprint. There are currently 14 states that have adapted California’s zero emission vehicle standards which is to make the pledge of gaining a certain percentage of residents to be driving EV in the following years. Today, less than 1% of cars on the road today are electric but with the following of these standards the goal is to reach 13% by 2035. By 2050, roughly 60% of new care sales are projected to be electric which is an unreal trend for shrinking our carbon footprint!


https://earthjustice.org/features/electric-vehicles-explainer?gclid=Cj0KCQjw06OTBhC_ARIsAAU1yOXrUfiOw95G56jAX46vwnxy1EZH959AqxzRxyVtKFjtaTtx0TlxPJYaAsllEALw_wcB


https://www.nytimes.com/interactive/2021/03/10/climate/electric-vehicle-fleet-turnover.html