Per capita plastic waste generation in US, Germany, Russia, Mexico, Egypt, China in 2016

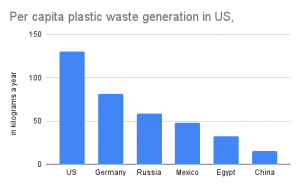
The graph that I have chosen to use is the data I found from Statista about plastic consumption in 2016. The data set included countries from over 20 countries, but I decided to pick 6 of the countries, ranging from levels of GDP, environmental awareness, and natural resources, etc. Unsurprisingly, the US ranked number one, which is 5 times of what china has. In today’s climate, the US made the public seem like other countries are doing way more harm to the environment than us ourselves, and this chart is really telling in terms of our contribution to environmental degradation.

On the other hand, I realised that GDP doesn’t necessarily reflect the consumption for plastic. according to Voanews, china accumulated 15.92 GDP vs the United States 23 GDP, however, the US uses 5 times more plastics than China. Therefore, environmental awareness is necessary regardless of level of GDP.

https://www.statista.com/statistics/1228043/plastic-waste-generation-per-capita-in-select-countries/

https://www.voanews.com/a/chinas-economy-could-overtake-us-economy-by-2030/6380892.html

Water usage from highly populated Countries in 2017

Water Usage by Country in 2017 per billions


When looking at water usage for highly dense countries, this pie graph shows the percentage use of water by each country.  However, I personally thought that water usage was mostly coming from showers, however with laundry, brushing your teeth, washing your hands and doing dishes contributes to how much water we use per day.  Surprisingly China had the highest amount using around 591.8 billion gallons in all of 2017.  I personally thought that the US would have used way more water usage, but when coming to terms with the population of China compared to the population of the United States, its no surprise that they are about 2 times larger when it comes to the US using 444.4 billion.  However, 2017 was about 5 years ago, and scientists have said that water usage has increased.  If there’s a continue increase of water usage in 5 years from now, who knows the results it will have for the irreversible effects of climate change.

resources:

https://ourworldindata.org/water-use-stress


Waste (in tons) Per Person in Landfills by State in 2019

One major issue in today’s society is waste production and management. In recent years, there have been many concerns about a rise in pollution and global temperatures. Ocean acidification and air pollution are two direct results of improper waste management, and these have negative impacts on all of us, and many can lead to long-lasting health conditions and problems. As can be seen in the graph, Connecticut had the lowest per capita waste presence in landfills, with 8.7 tons of waste products in 2019. The next lowest state is Massachusetts, with 16.2 tons of waste byproduct in landfills. The trend continues increasing, with several states remaining in the 16-18 ton range. With regards to North Dakota, Maryland, South Dakota, and Vermont, and Maine, the per capita presence of waste in landfills in 2019 ranged from 20.3 to 21.9 tons, respectively. This is an alarming statistic, and the total gap between Connecticut and Maine is 13.2 tons.

Sources Cited:

https://www.statista.com/statistics/591862/least-waste-per-capita-in-us-landfills-by-major-state/