Harvesting the Power of the Sun’s Rays

In the Last 10 years, the availability of solar power has increased due to the decrease in installation costs. In 2010, the price of installation in the U.S. was 4,731 dollars per kilowatt. In 2020, the price fell all the way down to 883 dollars per kilowatt. Making the installation process cheaper means that this sort of energy will be available to more people of varying economic classes. If we continue to make headway in refining certain solar panels and harvesting solar energy through water heating and plant-based solar extractions, we could reach commercial-level application sooner than we may think. When asked about solar power in an interview with Mathias Döpfner, Elon Musk predicted that our future civilizations are going to be primarily solar-powered. He continued by saying that the only problem would be finding an efficient way of storing excess solar energy on days when the weather would pose an issue. As we continue to make technological advancements in this field, the idea of solar panel farms will become more of a possibility. This alternative source of energy will soon grow to challenge the big fossil fuel giants one day. Some may see this as a threat but if we truly hope to make a dent in the climate change issue, we must progress with solar power.


https://www.ans.org/news/article-3812/elon-musk-shutting-down-nuclear-plants-is-total-madness/

https://www.statista.com/statistics/809796/global-solar-power-installation-cost-per-kilowatt/


Wind Energy!

There are many forms of non fossil-fuel based energy. But, for this post I will be specifically looking at wind energy. In order to understand wind energy, it is important to first understand wind. When the sun unevenly heats the Earth, that is when wind is created. Wind can then be used to create energy. Knowing this, wind energy is sustainable energy. It will continue to be a sustainable source of energy for as long as the sun continues to shine. Wind energy is caught by the giant windmills, called wind turbines, that tower over 100 feet in the air. Sometimes, the wind turbines work by themselves or they can also be connected to power grids or a solar cell system. When there is a decent amount of wind turbines clustered together it is called a wind plant, however only a handful of electricity providers use these wind plants to provide power for their customers.

Across the United States, there are 41 states have wind plants which have developed more than 100,000 jobs for American citizens. In fact, a wind turbine technician is one of the fastest growing jobs in America. It’s important to note that the wind industry is still growing and is nowhere near its peak. The most common use of wind turbines that are stand alone is to pump water. However, farmers could also use standalone wind turbines, as well as homeowners. When it comes to wind power, it is cost effective as it only costs “1–2 cents per kilowatt-hour after the production tax credit” (energy.gov). Lastly, the newly developing wind industry equals annual investments of over 10 billion dollars into the United States economy. This shows the promise and potential that the wind industry, as well as wind energy has.

Works Cited:
https://www.nrel.gov/research/re-wind.html

https://www.energy.gov/eere/wind/wind-energy-basics

https://www.energy.gov/eere/wind/advantages-and-challenges-wind-energy


Housing Disparities Reveal Racial Discrimination

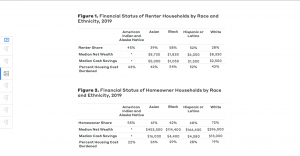
Safe and affordable housing is a primary concern to almost every single person living in the United States.  However, there are many disparities in the current housing system in the United States that reveal deeper levels of racism and discrimination.  As the graphs below show, the financial status and net worth of different races are shown.  The important thing to understand is that while financial status is the here and now, net worth is even more important since that becomes generational wealth for the future.  Nationally, black households only earned 61 cents per $1 of white households.  This disparity significantly affects the ability to afford housing and this form of racism persists over generations.  A black family is 16 times more likely than white families to experience 3 generations of poverty.  Even when both races make similar poverty-level wages, white households have an average net worth of $18,000 in savings while black families have either no savings or negative.  These racial disparities all play into housing issues.  When the recession hit in 2008, black and hispanic families that were approved for loans were 2.4 times more likely to receive a subprime(loans for people deemed to have difficulty paying back a loan) than white families.  Income and net worth are massive factors pertaining to housing and the differences between races in these areas emphasize racial discrimination that heavily affects non-white households’ ability to own a home and secure money for themselves and future generations.

Works Cited:

https://bipartisanpolicy.org/report/understanding-and-addressing-racial-and-ethnic-disparities-in-housing/

https://www.americanprogress.org/article/systemic-inequality-displacement-exclusion-segregation/


Income Inequality in America

Income inequities have always been around in the United States. Yet, over the past few decades the gap has grown. As seen in the pie charts you can see that since 1989 the top ten percent of income earners have grown 8% totaling a total 50% of all of the income in the United states. In 2016 the bottom 50% of income earners made between $0-53,000, the middle 50%-90% made between $53,000-$176,000, and the top ten percent make over $176,000 people.  The inequities are clear. What the chart doesn’t show is what percent of the wealth that the 1% have. According to Smart Asset, a personal finance website, the 1% makes nearly $600,000 a year, which shows that there is are huge inequalities among the top 10%.

https://www.stlouisfed.org/open-vault/2019/august/wealth-inequality-in-america-facts-figures

https://www.cnbc.com/amp/2022/01/24/how-much-money-you-have-to-earn-to-be-in-the-top-1percent-in-every-us-state.html

ESG Scores

I had never heard of an ESG score in my life. An ESG score stands for Environmental, Social, and Governance score. These are ratings that measure a company’s exposure to environmental, social, and governance risks. These risks include worker safety, energy efficiency, and board independence and all of these have financial implications. ESG scores/ratings can influence investors and may sway them for or against a specific company. What is interesting is that recent studies are showing that a 10 percent increase in corporate disclosure is associated with a 1.3 to 2 percent increase in ESG score variation among major ratings providers, which all interpret and process disclosures differently. More importantly, they are showing that the more information a company discloses about its ESG practices, the more rating agencies disagree on how well that company is performing along these dimensions. By being transparent about their ESG scores, companies are actually disadvantaging themselves! This seems contradictory but that is why the latest research is shocking. These companies have a lot to lose with more than $30 trillion in sustainable investment capital on the line…Investors are dumping massive savings into companies they believe will help provide sustainable futures, so if their transparency is allowing the rating agencies to hurt the company, then the investors will hurt financially as well. If these investors pull out on their investments, many promising companies looking to change the world by preaching sustainability may go out of existence. This newest research raises questions on the effectiveness of the rating system and if the rating agencies need further regulation. I think most people would agree that all companies and corporations in the United States need some oversight to make sure they are not harming the environment, but maybe the rating agencies need additional oversight as well.

Sustainable Fishing

There are many issues attached to the fishing industry: overfishing, bycatch, pollution, fish farming, and economics. This is why it is so vital to protect the fish and other marine life populations in the ocean. If the IPCC can determine and enforce sustainable fishing quotas the ocean will be well protected. But since the ocean is a global commons and there is no full authority over it regulations are difficult to make. Additionally, since the ocean covers the majority of our planet there is no way to actually enforce these regulations and ensure people/fishing companies are following them. There is one company called Seashepard that acts like a vigilante group which boards boats that are engaging in suspicious activity. Since the ocean is so vast it is also difficult to determine quotas since it is hard to figure out exact population numbers. Scientists often are estimating the population sizes of species and even then fishing companies still push for higher quotas. Even with bycatch and fish farming quotas have to be set. Bycatch because it is the unnecessary catching and killing of marine life while fishing. Fish farming because often fish caught from the ocean are used as feed for the farm bred fish. Additonally, the usage of sustainable fishing methods in terms of techniques used like long lines, and trollers. So in terms of mathematics there is a lot of estimating involved with fishing to establish effective quota levels that protect populations and encourage sustainable economic activity. There is an interesting documentary on Netflix called Seaspiracy that explains all the dynamics of the fishing industry. When buying fish look to see if it was locally sourced or fished sustainably and consumption is the driving force for the fishing industry so it’s important to support environmentally conscious brands.

Carbon Emissions

The United States emitted a grand total of 5,222 million metric tonnes of CO2 in 2020, which was an 11% decrease following the height of the COVID-19 pandemic, but this downward trend would prove to be only temporary. However, in comparison to 2005 CO2 emission levels, there was a 21% decrease, which I found to be interesting. In 2020 alone, carbon dioxide accounted for  ~79% of GHG emissions, while nitrous oxide, methane, and various fluorinated gases made up the other 21%. 27% of these emissions were caused by transportation alone, electricity contributed to 1/4 of these emissions, and the rest were sectioned off into industry, commercial usage, and, unsurprisingly, agricultural energy consumption. Ten years prior, the overall emission measurement (circa 2010) fell around 5,594 million metric tonnes, which while not a huge difference, really puts things in perspective. If we could somehow figure out a balance between all the above aspects of everyday life, and managed to cut back on energy consumption in a realistic yet sustainable way, it would be for the better.


sources:

https://www.epa.gov/ghgemissions/inventory-us-greenhouse-gas-emissions-and-sinks

https://www.statista.com/statistics/183943/us-carbon-dioxide-emissions-from-1999/