12/9/14
Winter Break Update
Introduction
During the winter break thus far I have made a lot of progress prototyping the first data acquisition system (DAS), codenamed Yorktown. The telemetry system as a whole is divided into two subsystems; the video system and the DAS. I have not been working on the video system portion of the project because it was tested at the end of fall term. Instead, I have focused on the DAS. In this report I will cover the Yorktown’s progress in four steps. First I will review the circuit design for Yorktown followed by the programming for the system. Then I will display several test results and go over conclusions. After covering the progress made on Yorktown I will then propose my design/thoughts for the next version of the system, Hornet.
Yorktown Circuit
The circuit design for the Yorktown system is relatively simple because of the nature of the I2C protocol. Figure 1 shows the current setup of the system.
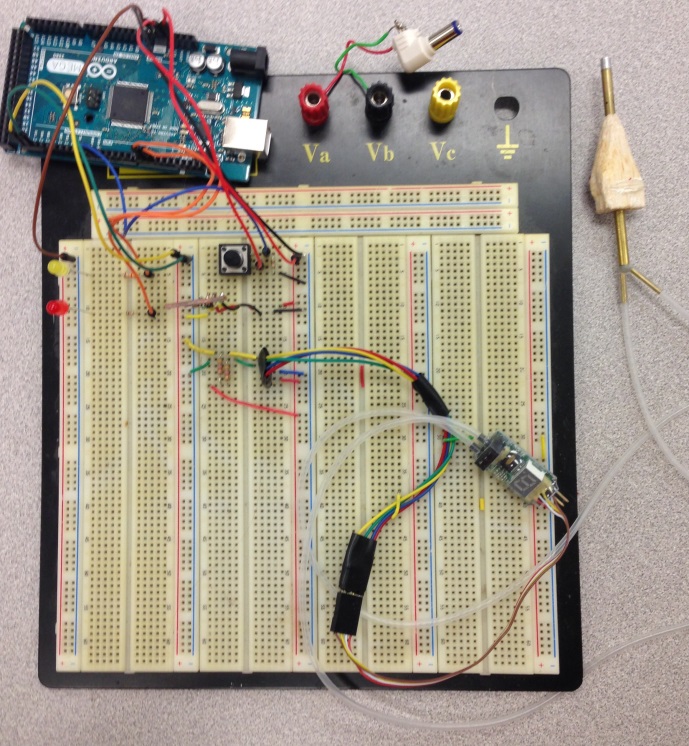
Figure 1: Yorktown circuit as of 12/9/14
The circuit design may be difficult to examine in Figure 1, so Figure 2 shows a theoretical circuit design for the Yorktown system.

Figure 2: Yorktown circuit diagram
As seen in Figure 2 there are two subsystems. One is the I2C system, on top, and the other is the control interface, on the bottom. The control interface consists of two LEDs, which are used to signal to the user the state of the system (off, ready, recording, or done), and the push button, attached to pin 2, is used to start the Yorktown system. More on control interface in the Yorktown code/process section.
The I2C circuit uses 3.3 V because the MPL3115A2 (altimeter) is not rated for 5 V and the EagleTree Air Speed Sensor V3 is rated for 3 V to 16 V. So the system used 3.3 V across the I2C bus. The data (SDA) and clock (SCL) lines are connected to the Vcc line by two pull-up 4.7 kΩ resistors. This is because the I2C protocol communicates by pulling the voltage down with transistors. Each I2C component is always high unless otherwise told to transmit a low (0) bit. This is why the resistors are needed to ensure 3.3 V throughout the SDA and SCL lines.
The control interface uses simple LED and button circuits with resistors. The button is connected to pin 2, not for any particular reason, while the LEDs are connected to pins 9 and 10. The actual pin number is not very important, as long as they are kept track of throughout the code. Further on in the project this circuit will be changed from a breadboard to a protoboard in order to reduce space.
Yorktown Code/Process
The bulk of the DAS is in the code. The Yorktown system acquires air speed, altitude (from pressure, and temperature. On the final DAS temperature may not be recorded because it is not required. Right now temperature is holding the place of another variable such as ground speed.
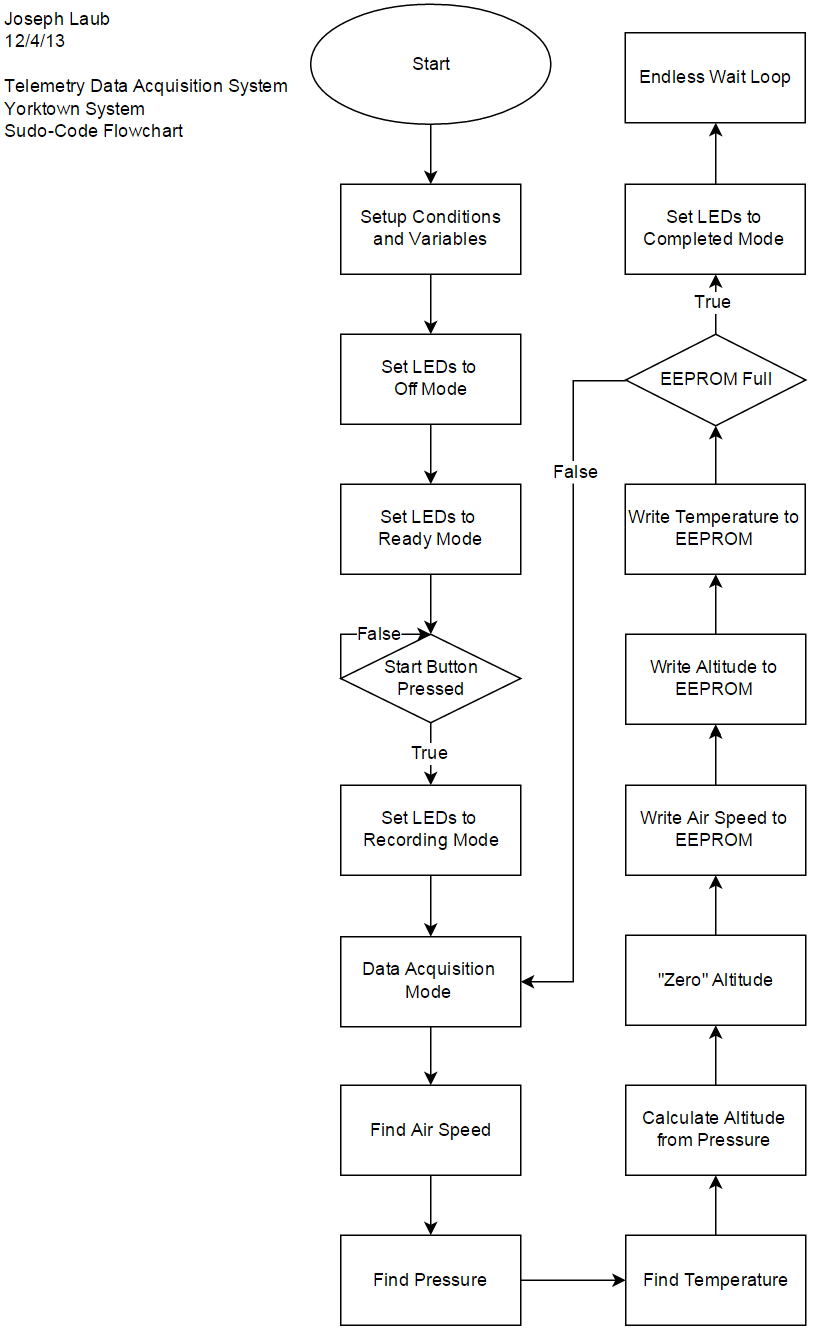
Figure 3: Yorktown Code Flowchart
Code for the Yorktown system can be seen in PDF files within the Yorktown code folder with this update log.
This code works by first setting up all that is required for the I2C system to work. I am using a library provided by SparkFun for the MPL3115A2 which eliminates some of the technicalities of I2C and allows me to just call certain functions for specific variables. The EagleTree sensor is barer and requires the wire library for accessing the I2C protocol.
Once everything is setup I put the LEDs in “ready” mode. This means that the yellow LED is on and the red LED is off. After this the code waits for the button connected to pin 2 to be pressed. Once the button is pressed the DAS loop is initiated and the “recording” (red) LED is on and the yellow LED is off. This loop finds air speed, pressure, and then temperature. From Equation 1 we can calculate the altitude based on the pressure (p).
![]() (Eq. 1)
(Eq. 1)
From Equation 1 we can solve for height (h) and get Equation 2.
 (Eq. 2)
This equation is broken into two parts for the Arduino and can be seen in the function pressureToAltitude(pressure).
When air speed, pressure, and temperature are found they are returned back to the main DAS loop. When altitude is returned to the loop I have multiplied it by 100 to preserve the decimal places since float variables cannot be returned, only integers. I then divide the returned altitude by 100 to bring it back to the actual recorded value. I separate out the decimal values of the altitude, Equation 3, and then save an integer version of the altitude, Equation 4.
![]() (Eq. 3)
(Eq. 3)
![]() (Eq. 4)
(Eq. 4)
This will prove useful when storing the data in memory because only integers can be stored.
Once all of the data is acquired I then zero out the altitude by saving the first altitude recorded and subtracting that value from every subsequent altitude. Now all of the data is ready to be stored and this is done by a simple EEPROM.write command that is given an address and a value. Then I check to see if the EEPROM is full and if it is not I continue acquiring data. If it is full then I stop the loop and put the LEDs in “Done,” mode (both are on). This is how the Yorktown system acquires data and stores it in the board’s EEPROM.
When Yorktown has finished storing data it can be read using the EERPOM.read command and a simple loop function. This data is then read in two columns. The first column is the address number (from 0 to 4095) and the second column is the stored values. These values are stored in a specific order that goes air speed, altitude, altitudeDecimal, temperature. This can be separated out using a MATLAB script that I have written that grabs every fourth index of a column.
Yorktown Results – See PowerPoint
ALTIMETER TESTS
15 minute tests of the altitude sensor. For these tests I left the altimeter sensor on the table for 15 minute without moving it. This data was not stored in the EEPROM but was instead printed to the serial display and then copied and pasted into MATLAB. These tests show some significant drifting issues with the altitude sensor. While the room did have other people working and moving around, this should not have affected the altitude but this much. Sometimes as much as 10 feet. There was also a significant amount of negative spiking that occurred in all three tests, although not so much the third which was on a separate day. I have noticed with this sensor a tendency to be negative some days, and nearly perfect other days. I am attributing this to the fact that the pressure changes all the time, and being indoors may have odd effects on the pressure. The fact that the altitude is sometimes negative does not bother me because it is the change in altitude that is important. This is why the drifting effect bothers me. However, other tests were more positive in their results when I was moving with the sensor. Later two more long tests were done and all 5 tests can be seen in Figure 8.

Figure 4: Yorktown 15 minute test 1.
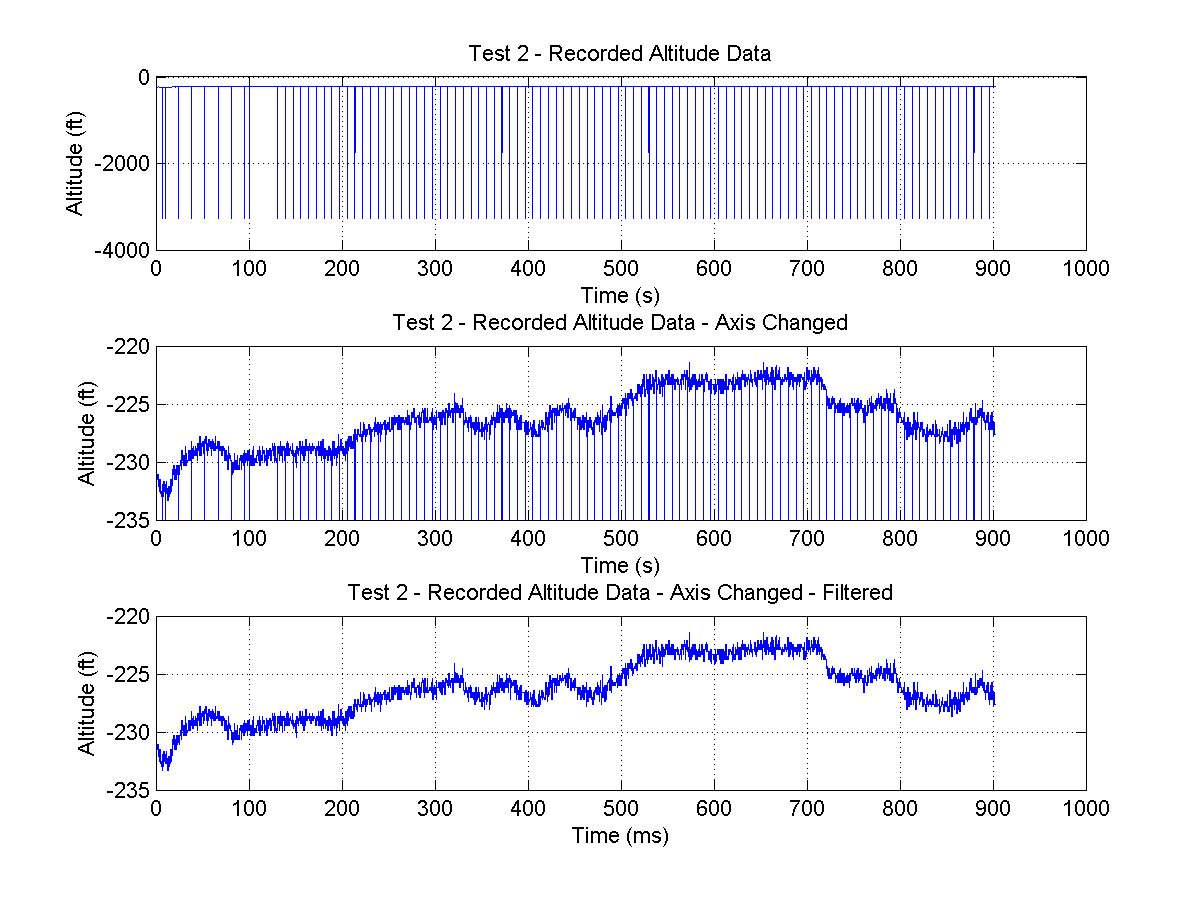
Figure 5: Yorktown 15 minute test 2.
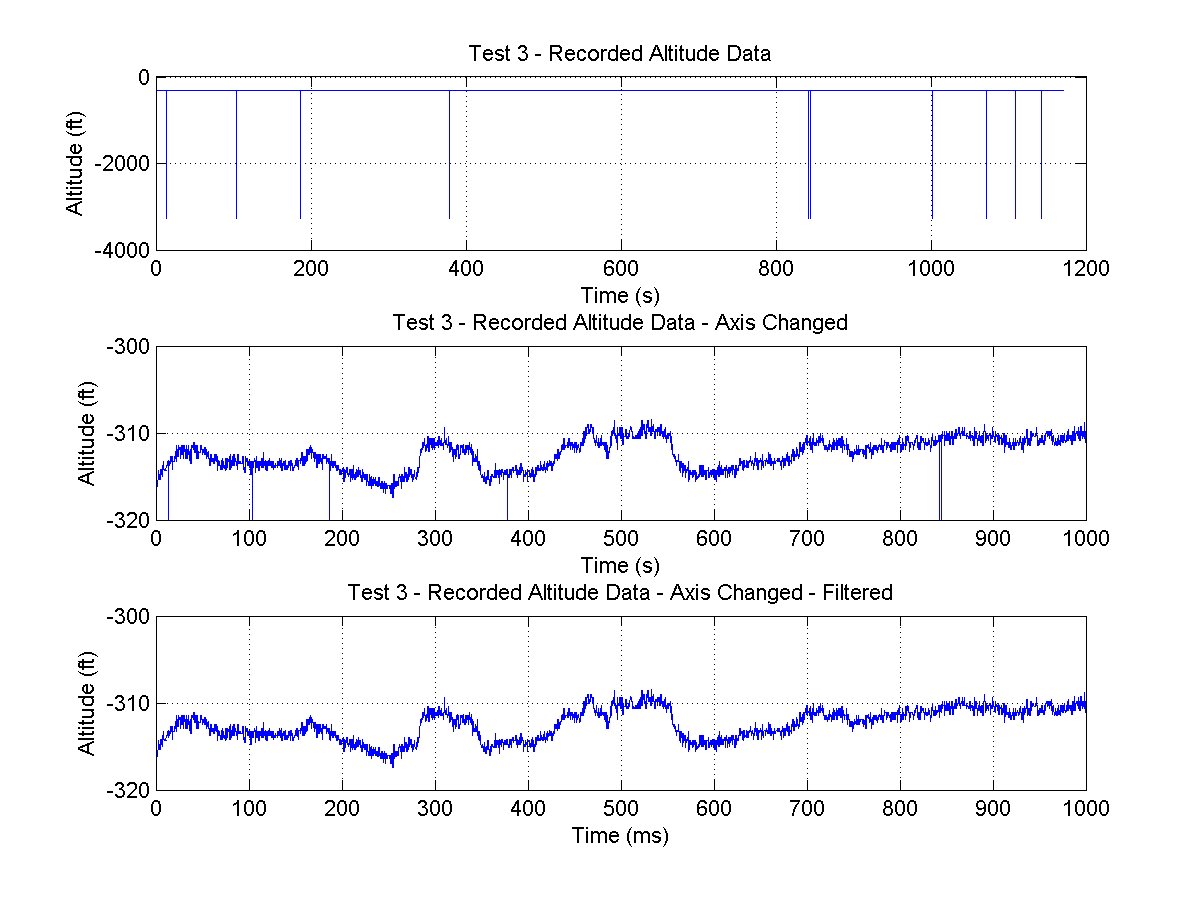
Figure 6: Yorktown 15 minute test 3.
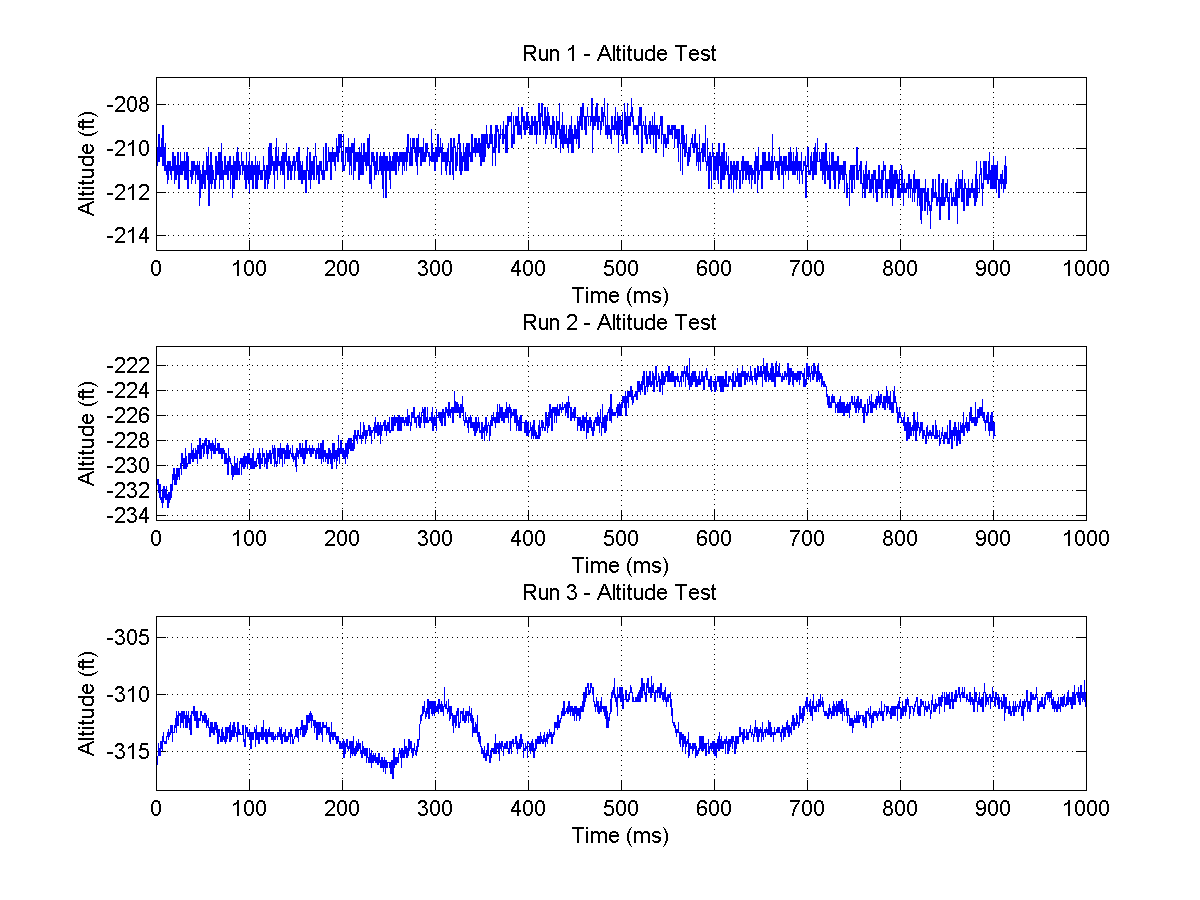
Figure 7: All three 15 minute tests filtered.
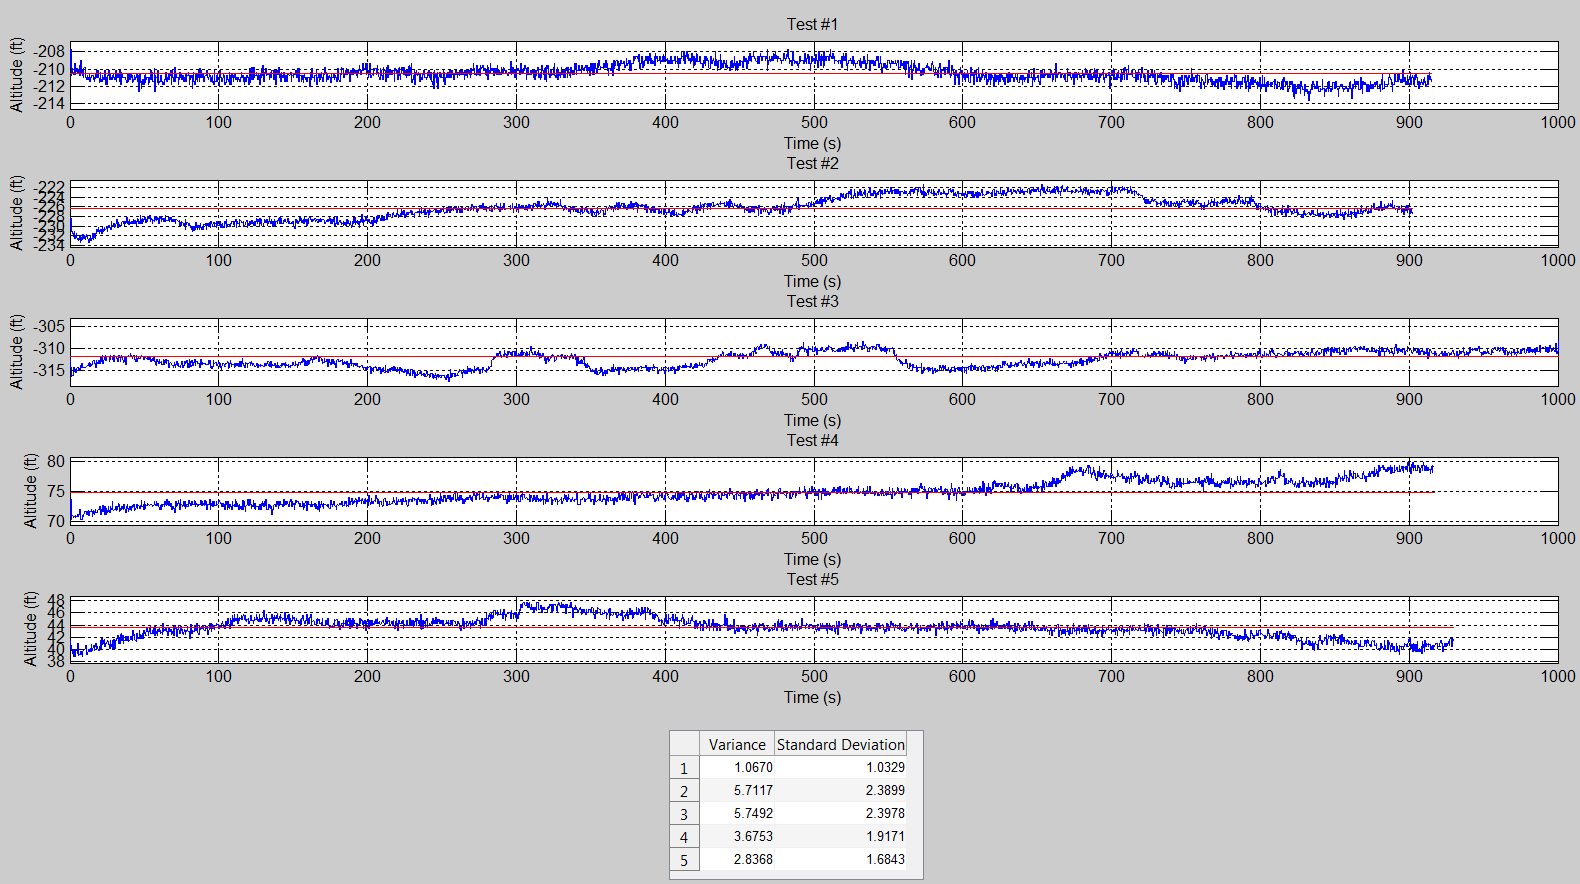
Figure 8: Yorktown five 15 minute tests and the variances.
Next is a test of the altimeter writing and reading to EEPROM. Here we can see how accuracy is lost when writing the altitude to the EEPROM.

Figure 9: Writing and Reading from EEPROM with the MPL3115A2.
AIR SPEED TESTS
For this test I held the air speed sensor tube fight up against the face of a fan by using a clamp and tried to measure a constant air speed. I’m not very sure if this test accurately shows the performance of the air speed sensor.

Figure 10: Air speed sensor fan test 2.
YORKTOWN SYSTEM TESTS
This test uses both sensors with all three data types. However, in this test I rounded the altitude values so that there were not decimal values. I did not do this for the temperature and a difference between the written and read temperature values can be seen.
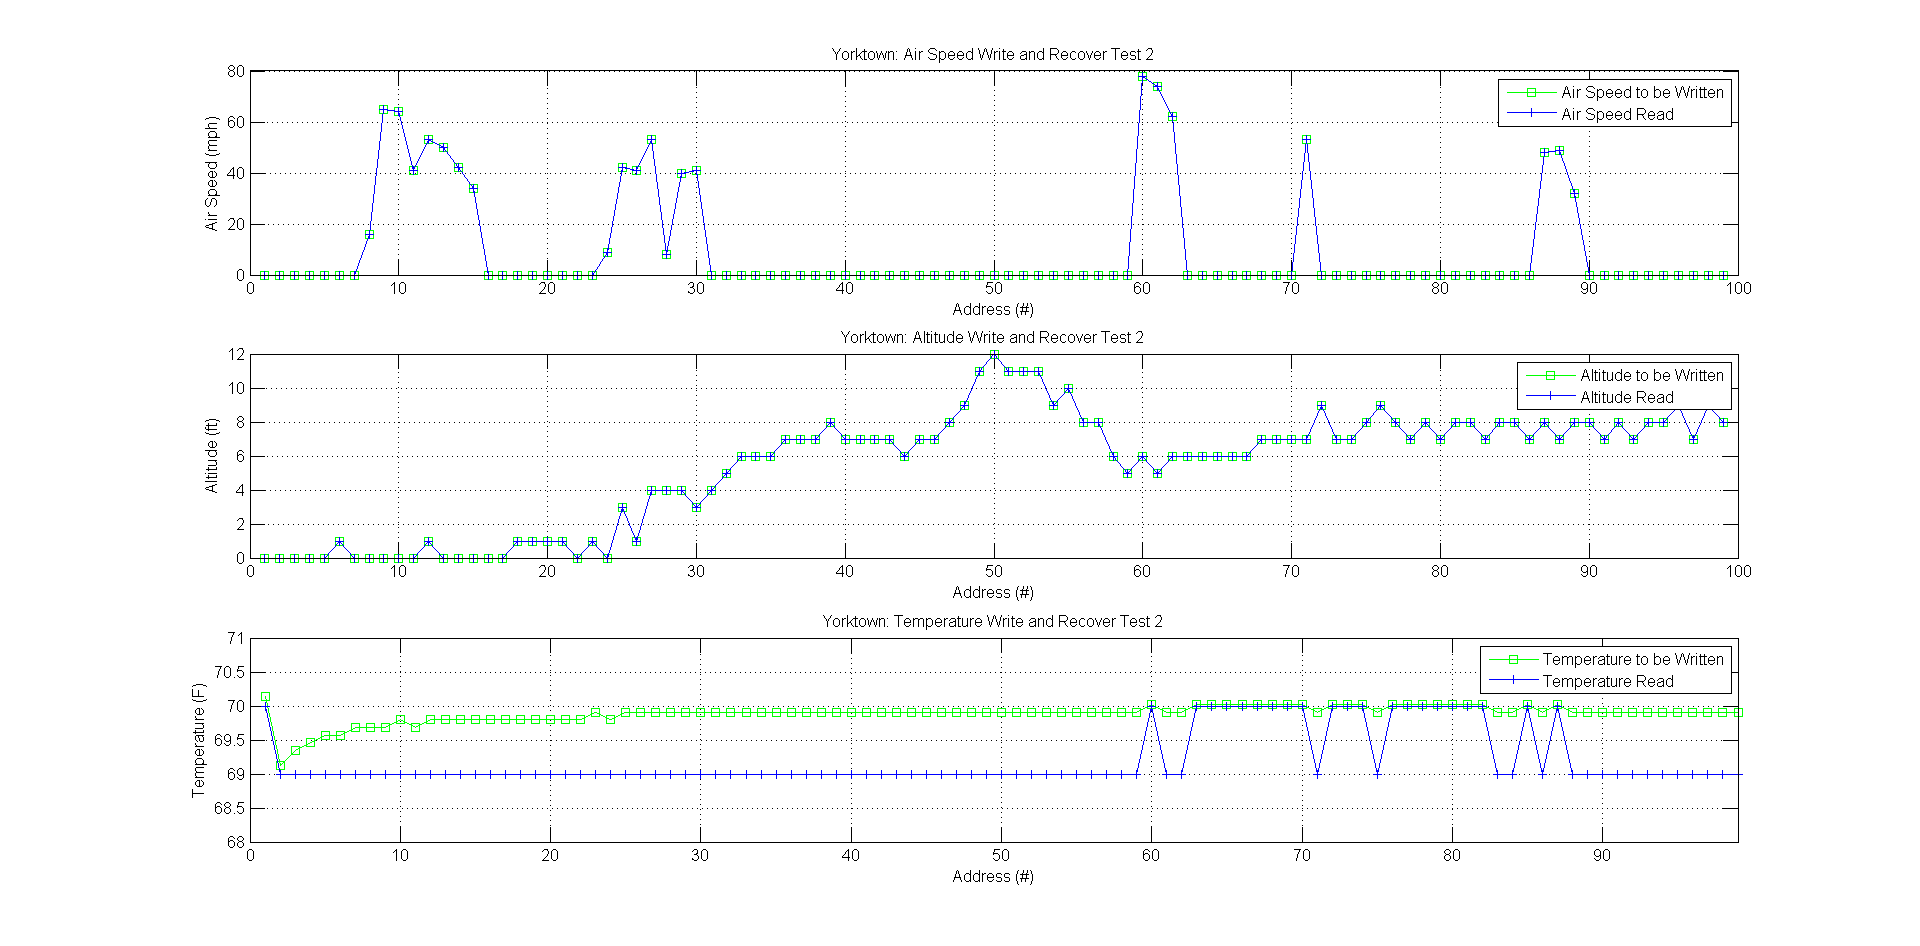
Figure 11: Full Yorktown test with air speed, altitude, and temperature.
Figure 12 shows an autonomous test of the Yorktown system. I connected the system to an external power supply instead of the computer and set it to record. This test shows an issue that I have encountered when running the system autonomously. The first data point of altitude recorded is used as the zero point for the tests. Then I usually add a threshold, in Figure 12 it is 50, to ensure that the altimeter never goes negative which would not be writable for EEPROM. But even when I zero out the altitude using this method the first two data points are extremely different, sometimes different by a 100 feet or even 400 feet. This is an issue only seen when the system runs on its own without a computer. I am still assessing this issue.
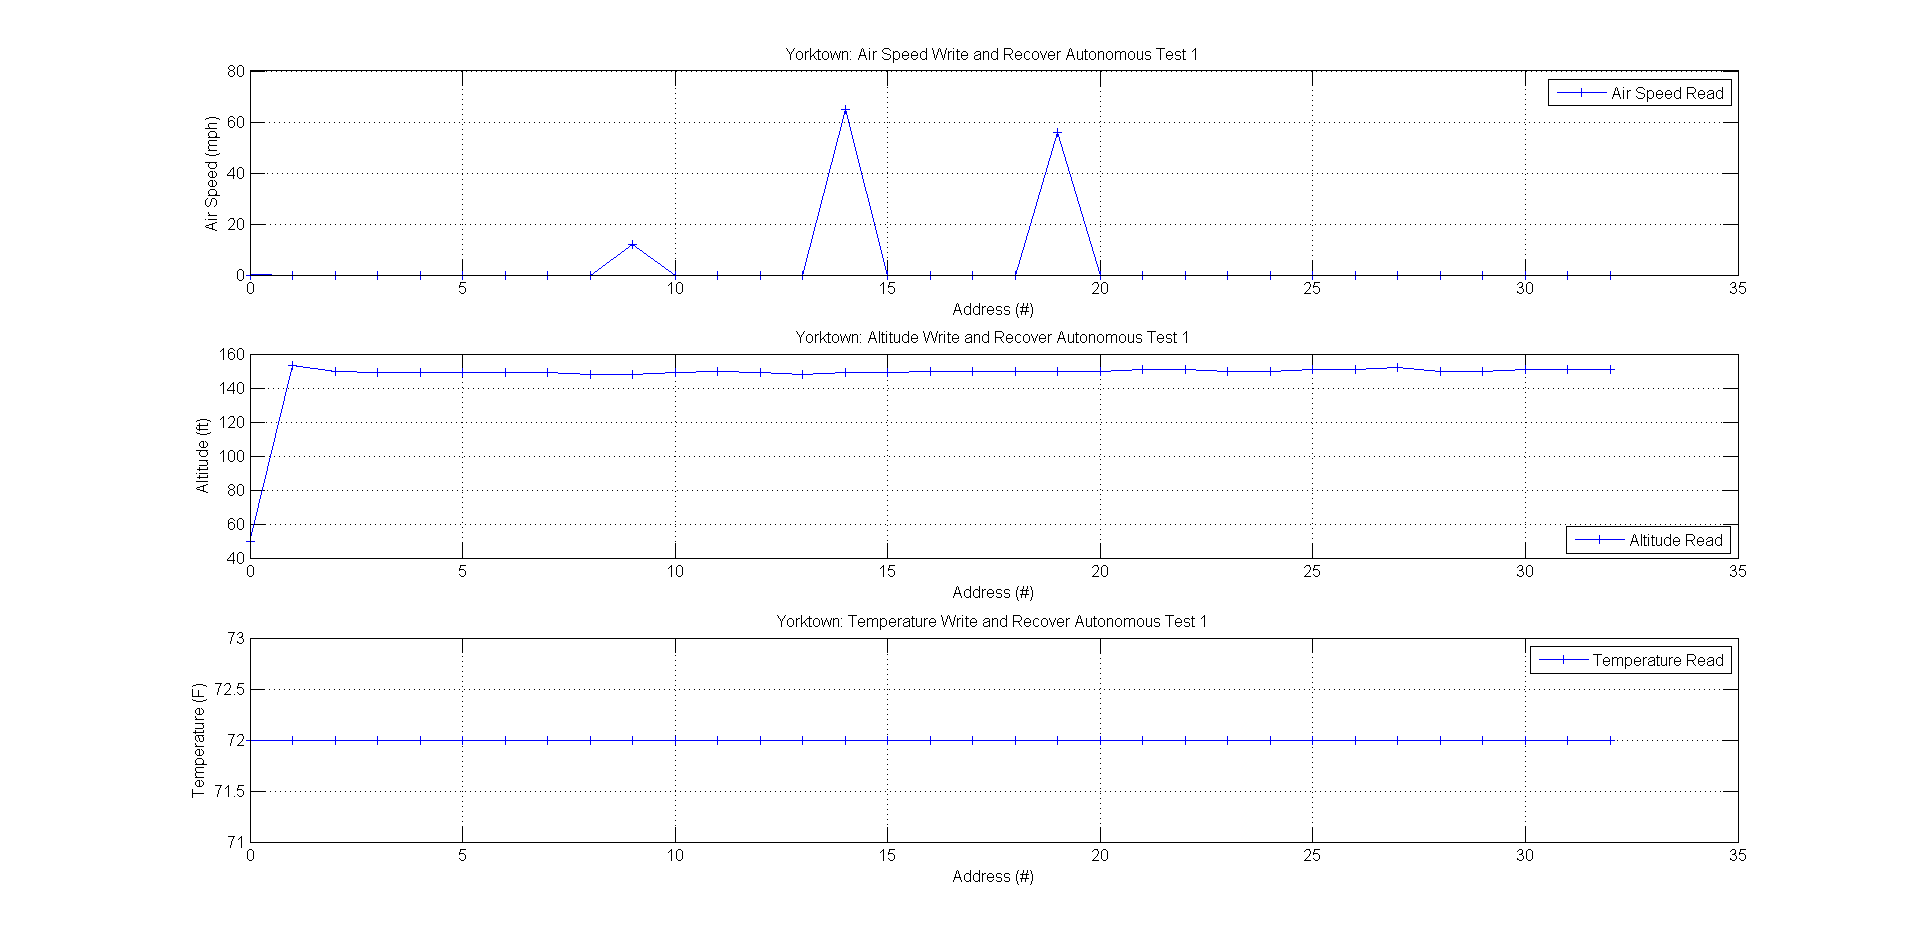
Figure 12: Yorktown autonomous test 1.
It was at this point that I set out to record the decimal places of the altitude. As described in the Yorktown Code/Process section I separated out the decimal portions of the altitude and Figure 13 shows this altitude data read in a higher detail than before because of the decimal places.

Figure 13: Altitude decimal places test.
The final Yorktown test was the stairwell test. For this test I walked up and down the stairwell at the end of the EE hallway. The stairwell is approximately 31 feet from the floor to the top of the third floor railing. Figures 14 and 15 show the results of these tests. I had to filter the data because of the first data point problem. Test 2 shows a max difference of 31.65 feet and test 3 shows a max difference 34.18 feet.

Figure 14: Yorktown stairwell test 2.

Figure 15: Yorktown stairwell test 3.
Yorktown Conclusions
My conclusions for the Yorktown system are mostly positive. I was able to get both of the sensors working with the Arduino Mega 2560 using the I2C protocol. I like using the I2C method. It is somewhat complicated to get starting in code; however, the circuitry is very simple and straightforward. Once the code works it is easily manipulated and configured to whatever system I need. Using the EEPROM to store the data is very simple; it is built well into the Arduino and is easy to retrieve. However, after seeing the Arduino Mega and my system work, I am now reconsidering my choice of microcontroller because I may need more than the allotted 4kB.
I have learned a lot about the Arduino and the I2C protocol. Testing the altimeter was at first stressful because of the drifting effects, but once I tested it in the stairwell I found that the sensor performs much better when it is actually moving around and not stationary (or at least it seems this way). Some days the altitude recorded is spot on with my altitude in the building (checked against GPS readings) and other days it is reading very negative values, but the sensor does well in practice.
The air speed sensor was easily integrated into the circuit and system and when I blow into the tube to simulate air flow it gives back results that seem accurate but have not been checked. From this Yorktown system I have learned a lot about design and testing. I am taking what I learned from this break so far and putting it towards my proposal for the next stage of the system, the Hornet.
Hornet Proposal
The Hornet system will use three sensors, two EEPROM chips, and the Arduino Pro Mini. The air speed sensor and altimeter will stay the same from the Yorktown, however, I will be adding a GPS sensor. This GPS sensor is called the Navigatron V2 and is built with I2C in mind. The EEPROM chips hold 256kbits each (8x larger than the Arduino Mega 2560).
The addition of two EEPROM chips will allow me to store 64000 bytes of information without using the Arduino Mega or Mini’s EEPROM. These EEPROM chips are I2C accessible, so they will join the I2C bus that the sensors use.
I am looking into RF transmitters/receivers now for the Hornet system. My concerns are with range and if the 434 MHz components can be dependable. They are very cheap, but I would hate to waste time with components that won’t work. I looked at a 315 MHz system but 315 MHz’s fifth harmonic overlaps almost exactly with GPS’ frequency, whereas 434 MHz does not.
In short, the difference between Hornet and Yorktown is that Hornet will have a smaller Arduino, 16x as much memory, a GPS, RF capabilities, and plug in connectors for each I2C component.
Recent Comments