2/20/15 Update
2/20/15
This past week I have made progress with the GPS, a new Time of Flight sensor, EEPROM memory, and system robustness. I was able to use serial communication to access the GPS NMEA information with my computer. Below is an example of the NMEA sentences recovered from the GPS using the program puTTY.
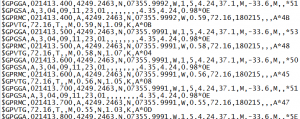
Figure 1: NMEA sentences recovered from College Park Hall.
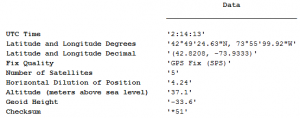
Figure 2: Fix Information (GGA) sentence information made clear using MATLAB.
I wrote a MATLAB script to decode the sentence information and make it more understandable to the user. The GPS latitude and longitude information was accurate. When I entered the information into Google Maps it was able to find the spot in which I was working.

Figure 3: Google Maps with GPS location data.
This confirms that the GPS is function correctly and that the problem I am having is a problem with the I2C protocol communication and not a broken sensor. When I tested the GPS using I2C I received zeros for the location data, even though I had not reset the GPS after getting the information Serially. Now I need to use a logic analyzer to see what is actually being sent and received between the Arduino and GPS.
Last week Professor Hedrick introduced me to a new Time of Flight sensor, seen below, that measures distance using IR and the time it takes for the reflection to return to the sensor.

Figure 4: VL6180 Time of Flight sensor.
The VL6180 is designed for I2C and operates between 2.8 V and 3.3 V and returns the range to a target (like a wall or floor for example). The datasheet claims a maximum distance of 25 cm and does not specify a minimum range. I was able to use this sensor successfully and obtain distance, in mm, to target. I found that under low light conditions (no lights on in the lab, just the sunlight from the windows) the range was about 15 cm, however, there is a gain function in the sensor and this can be used to boost sensitivity. I have not yet messed with the gain setting in the sensor, which is controlled with I2C, because under decent (lights on in the room) lighting conditions I was able to get results up to 25 cm. This sensor can be mounted on the bottom of the plane and help determine when the plane takes off and lands. The bottom of the fuselage to the ground is about 7-8 cm which is well within the range of the sensor.
This week I integrated the EEPROM chip into the main telemetry system. This chip also uses I2C protocol and was relatively simple to use. Now the Hornet telemetry system has 32KB worth of space which is equivalent to about 20.5 minutes at a system sample rate of 1 second (system sample rate is defined as the time it takes to gather one sample of each data type). Even at a system sample rate of half a second (about 10 minutes of data) there is still plenty of space for an entire flight’s worth of data since an average flight is about 2.5 to 3 minutes (by watching footage from last year’s competition).
Lastly, an improved sketch allows the system button to start and then stop the data recording without corrupting data or causing indirect errors and uses flags to mark the end point. The system will be able to transmit live altitude data to the ground station. My goals for the next week are to practice my demonstration and make sure that the system operates correctly, practice my oral presentation, finish the poster board, and record my video demonstration. The GPS is the last primary goal that needs to be met for the system. After the GPS sensor works with I2C I will then focus of improving system robustness and repeatability.
2/11/15 Update
2/11/15
This week I continued GPS testing, got the RF communication working, and received the I2C memory chips in the mail (finally). I am still unable to read anything from the GPS by serial or I2C communication. I have tried several different serial communication programs such as Command Prompt, MiniGPS, PuTTY, and the Arduino IDE. For every test I get nothing. Not even garbage results, I just don’t get anything in terms of results. I am considering finding another GPS now, but first I would like to sit down with Professor Hedrick and/or Professor Spinelli to see if they can help me establish some sort of a connection. JP has also been working with GPS sensors for his project and I will talk to him this week as well. If I cannot any results from this Navigatron V2 sensor by the start of next week then I will order a different sensor and try and return this one if possible/necessary.
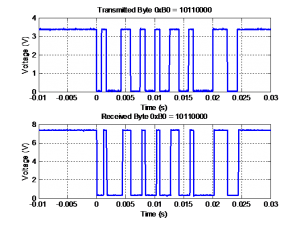
This week I was able to establish a connection between the transmitter and receiver. The components operate at 434 MHz and use amplitude shift keying (ASK) to communicate with each other. Below is an example of a transmitted and received byte of information.
I was finding a lot of problems with this method at first. Since the components use ASK, they are very susceptible to noise. There would be lots of moments when the received scan on the oscilloscope just look static. The plot above was after a few tries to get a clear scan of the received signal. The code I was using the transmit and receive was also unable to interrupt the received signal.
I found an Arduino library called Virtual Wire and adopted that for the project. Using the library I was successfully able to transmit and receive information. This is because Virtual Wire provides a lot of features for transmitting ASK information. It includes a lot of checksums for data verification. This allowed me to transmit and receive data because the Virtual Wire library was able to help filter out the noise and focus on the actual information transmitted. I had trouble at first using the Virtual Wire functions because they were setup with sending ‘char’ variables in mind and not integers, but this was soon fixed by converting integers into char variables.
In other news the I2C memory chips arrived today and I should be able to get those working soon. From what I have read they should be simple and easy to use, but we will see. My goals for next week are to: make a decision/progress with the GPS and integrate the memory chips.
1/30/15 Update
1/30/15
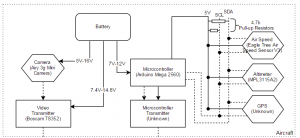
This week I worked primarily on the user interface for the telemetry system. I added a button and two LEDs (one red and the other yellow) to a protoboard. This UI can be bolted onto the outside of the plane for ease-of-use. Below is an up-to-date block diagram for the telemetry system on board the aircraft.

I was unable to work with the GPS this week, however, I spoke with Professor Hedrick about GPS and I2C and he has also had bad experiences with the devices. He and I are going to meet next week with a logic analyzer to look at what is actually being sent/received on the data bus line.
Before I meet with Professor Hedrick my goals are to work with the FDTI connection on the GPS. This should allow me to connect directly to my computer and read the NEMA lines from the GPS. Hopefully by confirming that this NEMA lines are accurate (as in I am getting reasonable location, altitude, and time data) then I will know that the issue with the Navigatron is a communication issue. Then when Professor Hedrick and I analyze the data we will know that the GPS itself is receiving accurate data.
This week I will also begin testing the transmitter/receiver combination and the goal for this week is to send one byte from the Arduino Mini to the Arduino Mega accurately. I will also speak with Mike Russo, the club president, about using a small recreation drone to test fly the telemetry system. Ervin and I will also begin trying to power the motor, servos, and telemetry system from the one 6 cell battery because only one power source is allowed on the aircraft.
1/23/15 Update
1/23/15
Over this past weekend I continued testing the GPS sensor for a location fix. The results I got from the GPS indicate that either I do not actually have a fix, or I am reading the information incorrectly. I believe that I do have at least a 2D fix because the LED indicator lights are solid (I read that solid indicates a fix and blinking is searching). I think the problem is in how I am reading the GPS data. I’m not sure why it is a problem since I am using the given sample code. I have tried to find more documentation on what the actual returned bytes mean from the status registers, but I have yet to find anything. I even reached out to the company and they forwarded me to a forum that I’ve been to already.
For this past week I set aside the GPS and focused on making sure telemetry was going to be ready for this Sunday. I replaced the Arduino Mega with the Arduino Mini Pro, used stranded wires, and modified the code so that I could control the system more easily. The system also runs continuously now, instead of stopping. I made the system easier to use by adding a built in ‘read EEPROM’ command so that I would not have to reupload code between tests. I then made a small cardboard structure for the system to stick to. This should reduce movement and keep the telemetry system together during flight.
My goals for next week are to continue testing the GPS and implement the RF communication to the ground station Arduino. I will resume GPS tests on Monday and plan to better diagnose what the data is that I’m getting.
1/14/15 Update
1/14/15
Over the winter break I designed and built the first telemetry system prototype named Yorktown. This system used the Arduino Mega 2560, the MPL3115A2 altimeter, and the EagleTree Airspeed Sensor V2. Using the on board EEPROM I was able to store 4096 bytes of information from the sensors. This system was tested successfully several times without the aircraft. Time, altitude, temperature, and air speed were all recorded. When Yorktown was integrated into the aircraft and tested during the first test runs of the aircraft the serial clock line wire broke off of the Arduino. The meant that no telemetry information was recorded during the first test ‘fight’ of the aircraft. From this I have learned to package my telemetry system more carefully, shrink the system’s area, and use stranded wire.
The next telemetry system that I am designing will improve upon the Yorktown design by meeting the lessons learned above. This system, named Hornet, will use an Arduino Mini (about a sixth the size of the Mega), both the altimeter and air speed sensors from Yorktown, new EEPROM chips (increasing the memory from 4 kB to 32 kB), a new GPS sensor, and RF link components to begin testing the ground station portion of telemetry. The ground station will use the Arduino Mega from the Yorktown system.
I have currently been testing the GPS sensor so that I can integrate it into the Hornet system. This testing process has been slow because I have been going to the football field bleachers for testing. So far the altitude and ground speed information that I have been recording has been incorrect. The altitude is constantly reading 6533 meters (even when I go up and down the bleachers) and the ground speed ranges from 26900 m/s to 27100 m/s and I am not nearly that fast. See Figure 1 below for results.
My goals for next week are to figure out why the data being recorded from the GPS sensor is incorrect and order the remainder of the parts for the Hornet system. Mike Russo, the president of the Aero Club, also has a small drone that he has volunteering for telemetry testing. This will be something else to explore after the GPS is working correctly.

Figure 1: GPS test results from going up the football bleachers.
12/9/14 Winter Break Update
12/9/14
Winter Break Update
Introduction
During the winter break thus far I have made a lot of progress prototyping the first data acquisition system (DAS), codenamed Yorktown. The telemetry system as a whole is divided into two subsystems; the video system and the DAS. I have not been working on the video system portion of the project because it was tested at the end of fall term. Instead, I have focused on the DAS. In this report I will cover the Yorktown’s progress in four steps. First I will review the circuit design for Yorktown followed by the programming for the system. Then I will display several test results and go over conclusions. After covering the progress made on Yorktown I will then propose my design/thoughts for the next version of the system, Hornet.
Yorktown Circuit
The circuit design for the Yorktown system is relatively simple because of the nature of the I2C protocol. Figure 1 shows the current setup of the system.
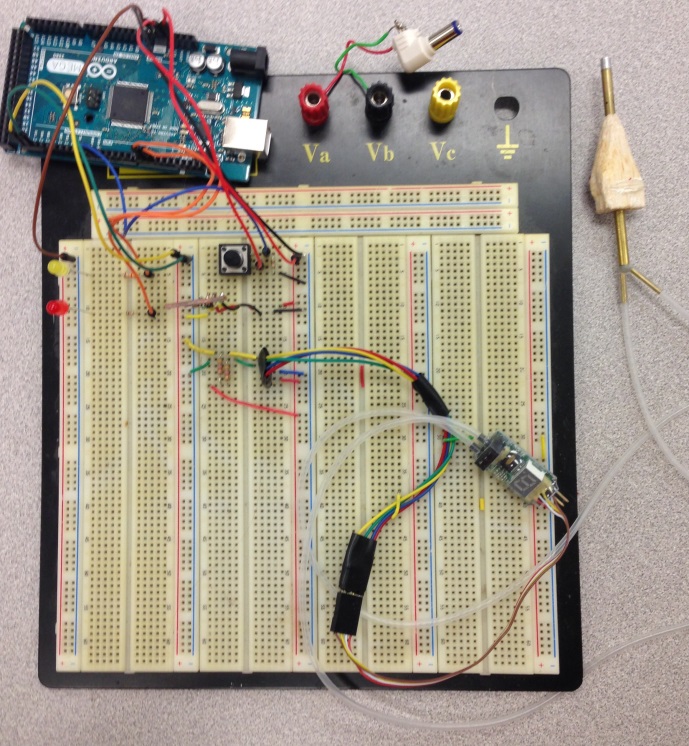
Figure 1: Yorktown circuit as of 12/9/14
The circuit design may be difficult to examine in Figure 1, so Figure 2 shows a theoretical circuit design for the Yorktown system.

Figure 2: Yorktown circuit diagram
As seen in Figure 2 there are two subsystems. One is the I2C system, on top, and the other is the control interface, on the bottom. The control interface consists of two LEDs, which are used to signal to the user the state of the system (off, ready, recording, or done), and the push button, attached to pin 2, is used to start the Yorktown system. More on control interface in the Yorktown code/process section.
The I2C circuit uses 3.3 V because the MPL3115A2 (altimeter) is not rated for 5 V and the EagleTree Air Speed Sensor V3 is rated for 3 V to 16 V. So the system used 3.3 V across the I2C bus. The data (SDA) and clock (SCL) lines are connected to the Vcc line by two pull-up 4.7 kΩ resistors. This is because the I2C protocol communicates by pulling the voltage down with transistors. Each I2C component is always high unless otherwise told to transmit a low (0) bit. This is why the resistors are needed to ensure 3.3 V throughout the SDA and SCL lines.
The control interface uses simple LED and button circuits with resistors. The button is connected to pin 2, not for any particular reason, while the LEDs are connected to pins 9 and 10. The actual pin number is not very important, as long as they are kept track of throughout the code. Further on in the project this circuit will be changed from a breadboard to a protoboard in order to reduce space.
Yorktown Code/Process
The bulk of the DAS is in the code. The Yorktown system acquires air speed, altitude (from pressure, and temperature. On the final DAS temperature may not be recorded because it is not required. Right now temperature is holding the place of another variable such as ground speed.
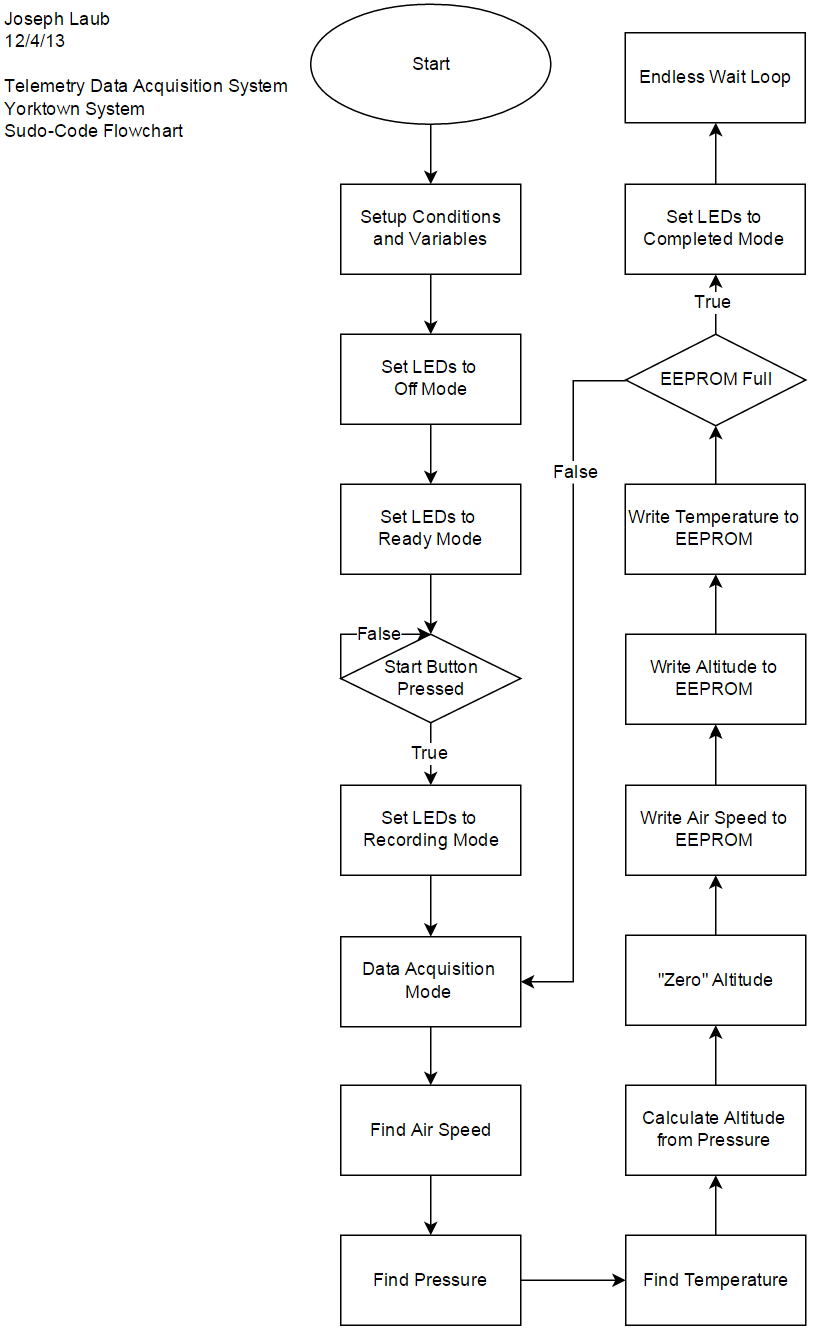
Figure 3: Yorktown Code Flowchart
Code for the Yorktown system can be seen in PDF files within the Yorktown code folder with this update log.
This code works by first setting up all that is required for the I2C system to work. I am using a library provided by SparkFun for the MPL3115A2 which eliminates some of the technicalities of I2C and allows me to just call certain functions for specific variables. The EagleTree sensor is barer and requires the wire library for accessing the I2C protocol.
Once everything is setup I put the LEDs in “ready” mode. This means that the yellow LED is on and the red LED is off. After this the code waits for the button connected to pin 2 to be pressed. Once the button is pressed the DAS loop is initiated and the “recording” (red) LED is on and the yellow LED is off. This loop finds air speed, pressure, and then temperature. From Equation 1 we can calculate the altitude based on the pressure (p).
![]() (Eq. 1)
(Eq. 1)
From Equation 1 we can solve for height (h) and get Equation 2.
 (Eq. 2)
This equation is broken into two parts for the Arduino and can be seen in the function pressureToAltitude(pressure).
When air speed, pressure, and temperature are found they are returned back to the main DAS loop. When altitude is returned to the loop I have multiplied it by 100 to preserve the decimal places since float variables cannot be returned, only integers. I then divide the returned altitude by 100 to bring it back to the actual recorded value. I separate out the decimal values of the altitude, Equation 3, and then save an integer version of the altitude, Equation 4.
![]() (Eq. 3)
(Eq. 3)
![]() (Eq. 4)
(Eq. 4)
This will prove useful when storing the data in memory because only integers can be stored.
Once all of the data is acquired I then zero out the altitude by saving the first altitude recorded and subtracting that value from every subsequent altitude. Now all of the data is ready to be stored and this is done by a simple EEPROM.write command that is given an address and a value. Then I check to see if the EEPROM is full and if it is not I continue acquiring data. If it is full then I stop the loop and put the LEDs in “Done,” mode (both are on). This is how the Yorktown system acquires data and stores it in the board’s EEPROM.
When Yorktown has finished storing data it can be read using the EERPOM.read command and a simple loop function. This data is then read in two columns. The first column is the address number (from 0 to 4095) and the second column is the stored values. These values are stored in a specific order that goes air speed, altitude, altitudeDecimal, temperature. This can be separated out using a MATLAB script that I have written that grabs every fourth index of a column.
Yorktown Results – See PowerPoint
ALTIMETER TESTS
15 minute tests of the altitude sensor. For these tests I left the altimeter sensor on the table for 15 minute without moving it. This data was not stored in the EEPROM but was instead printed to the serial display and then copied and pasted into MATLAB. These tests show some significant drifting issues with the altitude sensor. While the room did have other people working and moving around, this should not have affected the altitude but this much. Sometimes as much as 10 feet. There was also a significant amount of negative spiking that occurred in all three tests, although not so much the third which was on a separate day. I have noticed with this sensor a tendency to be negative some days, and nearly perfect other days. I am attributing this to the fact that the pressure changes all the time, and being indoors may have odd effects on the pressure. The fact that the altitude is sometimes negative does not bother me because it is the change in altitude that is important. This is why the drifting effect bothers me. However, other tests were more positive in their results when I was moving with the sensor. Later two more long tests were done and all 5 tests can be seen in Figure 8.

Figure 4: Yorktown 15 minute test 1.
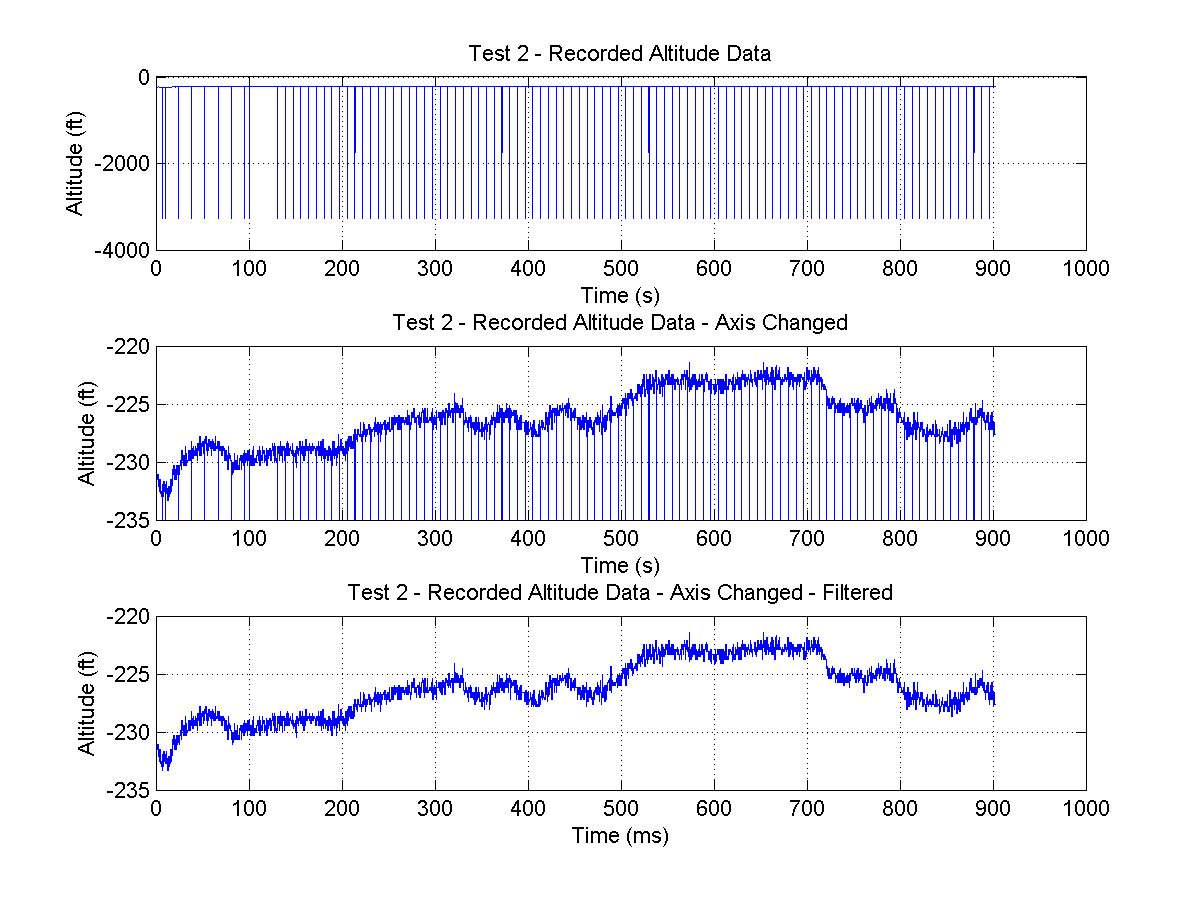
Figure 5: Yorktown 15 minute test 2.
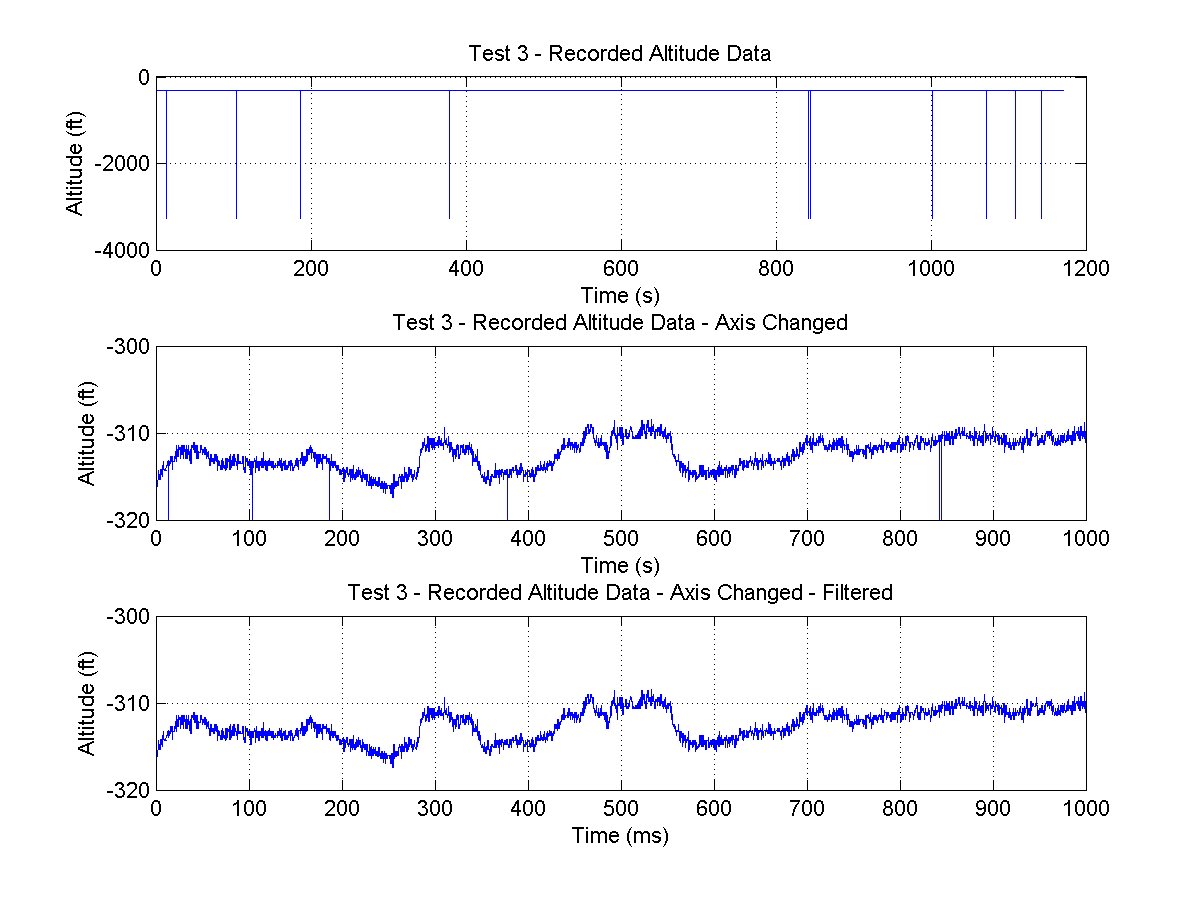
Figure 6: Yorktown 15 minute test 3.
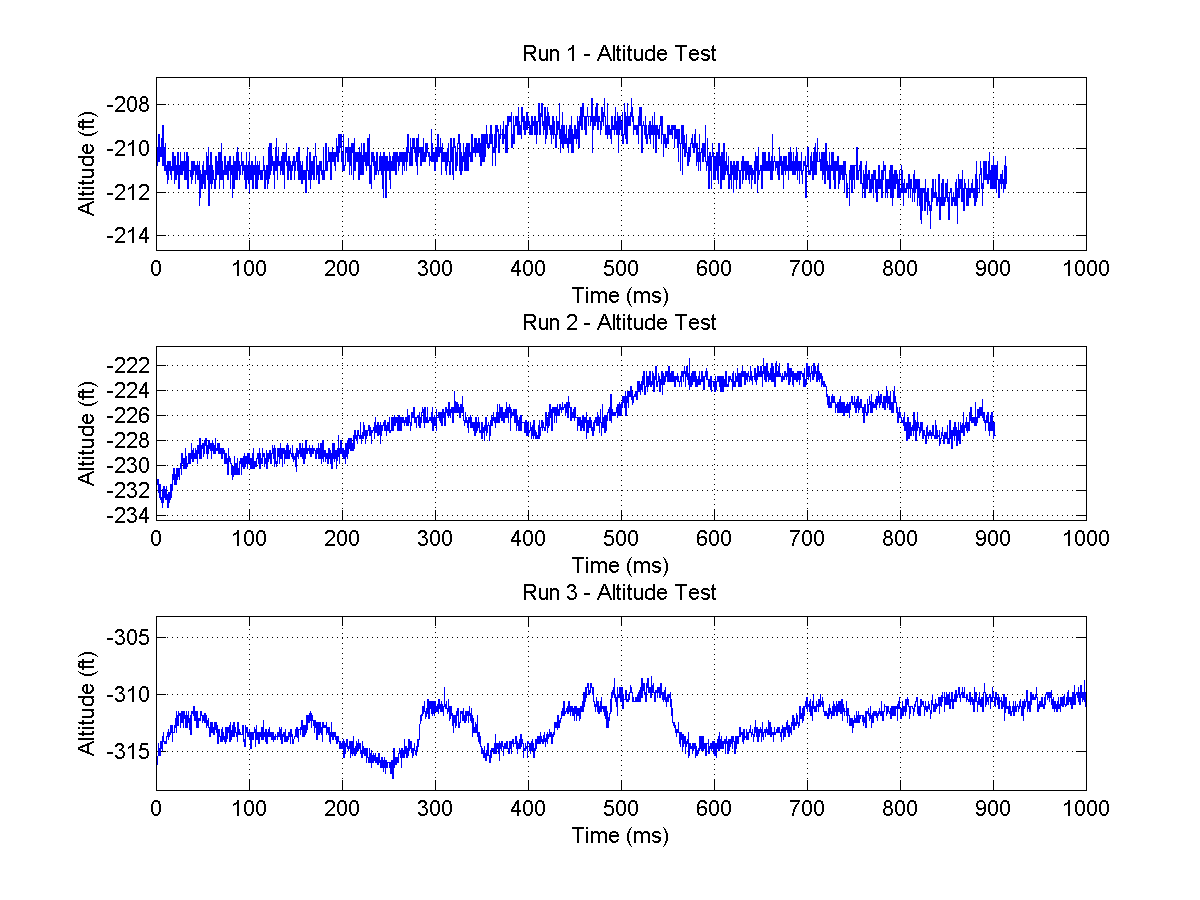
Figure 7: All three 15 minute tests filtered.
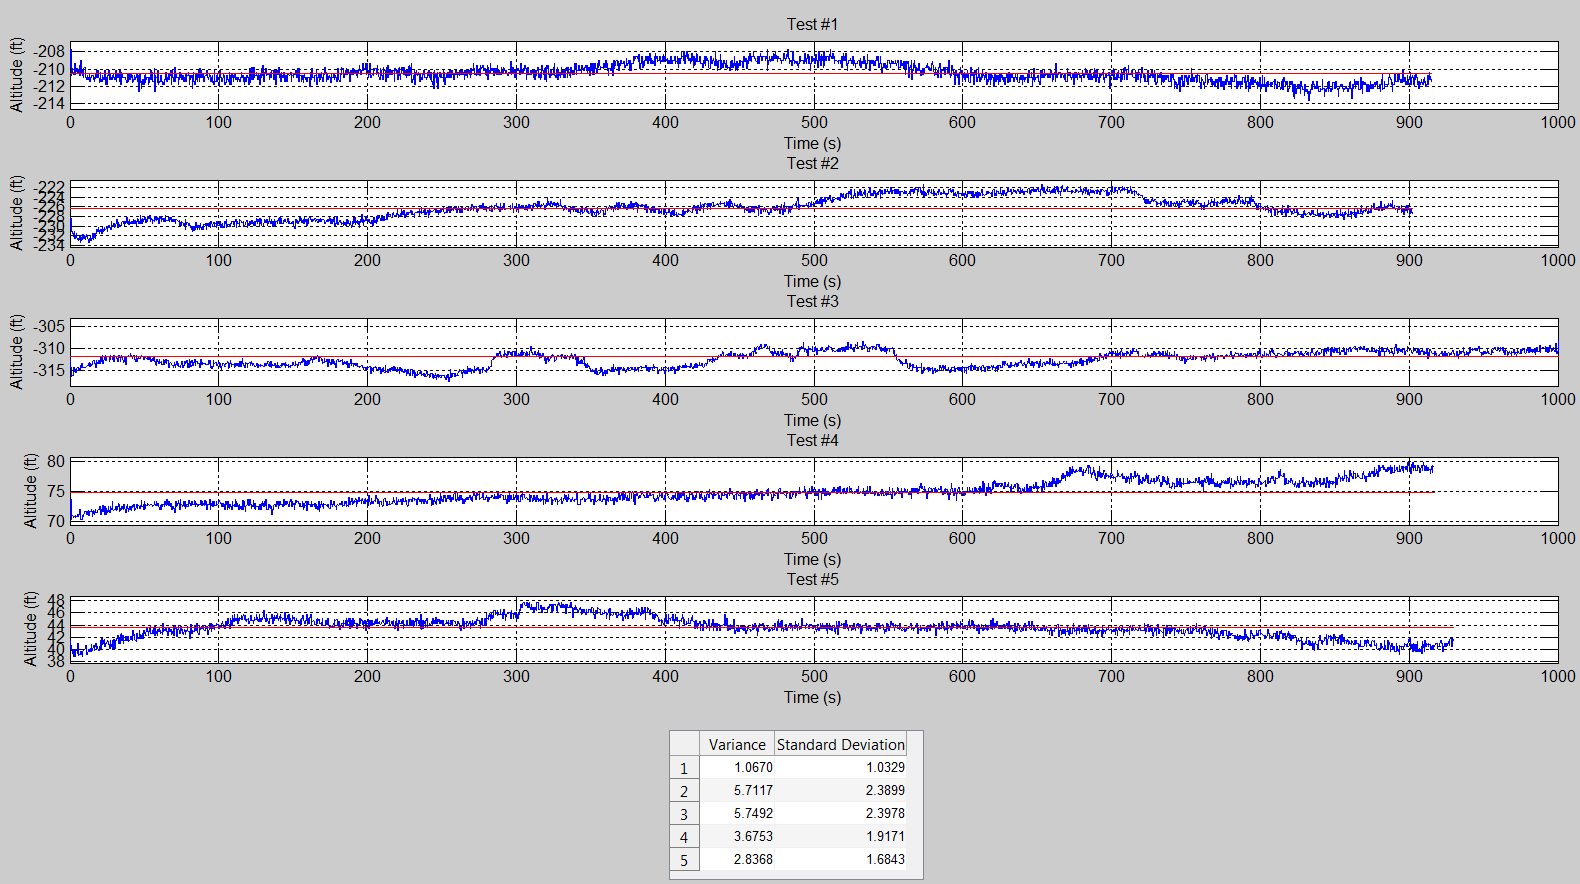
Figure 8: Yorktown five 15 minute tests and the variances.
Next is a test of the altimeter writing and reading to EEPROM. Here we can see how accuracy is lost when writing the altitude to the EEPROM.

Figure 9: Writing and Reading from EEPROM with the MPL3115A2.
AIR SPEED TESTS
For this test I held the air speed sensor tube fight up against the face of a fan by using a clamp and tried to measure a constant air speed. I’m not very sure if this test accurately shows the performance of the air speed sensor.

Figure 10: Air speed sensor fan test 2.
YORKTOWN SYSTEM TESTS
This test uses both sensors with all three data types. However, in this test I rounded the altitude values so that there were not decimal values. I did not do this for the temperature and a difference between the written and read temperature values can be seen.
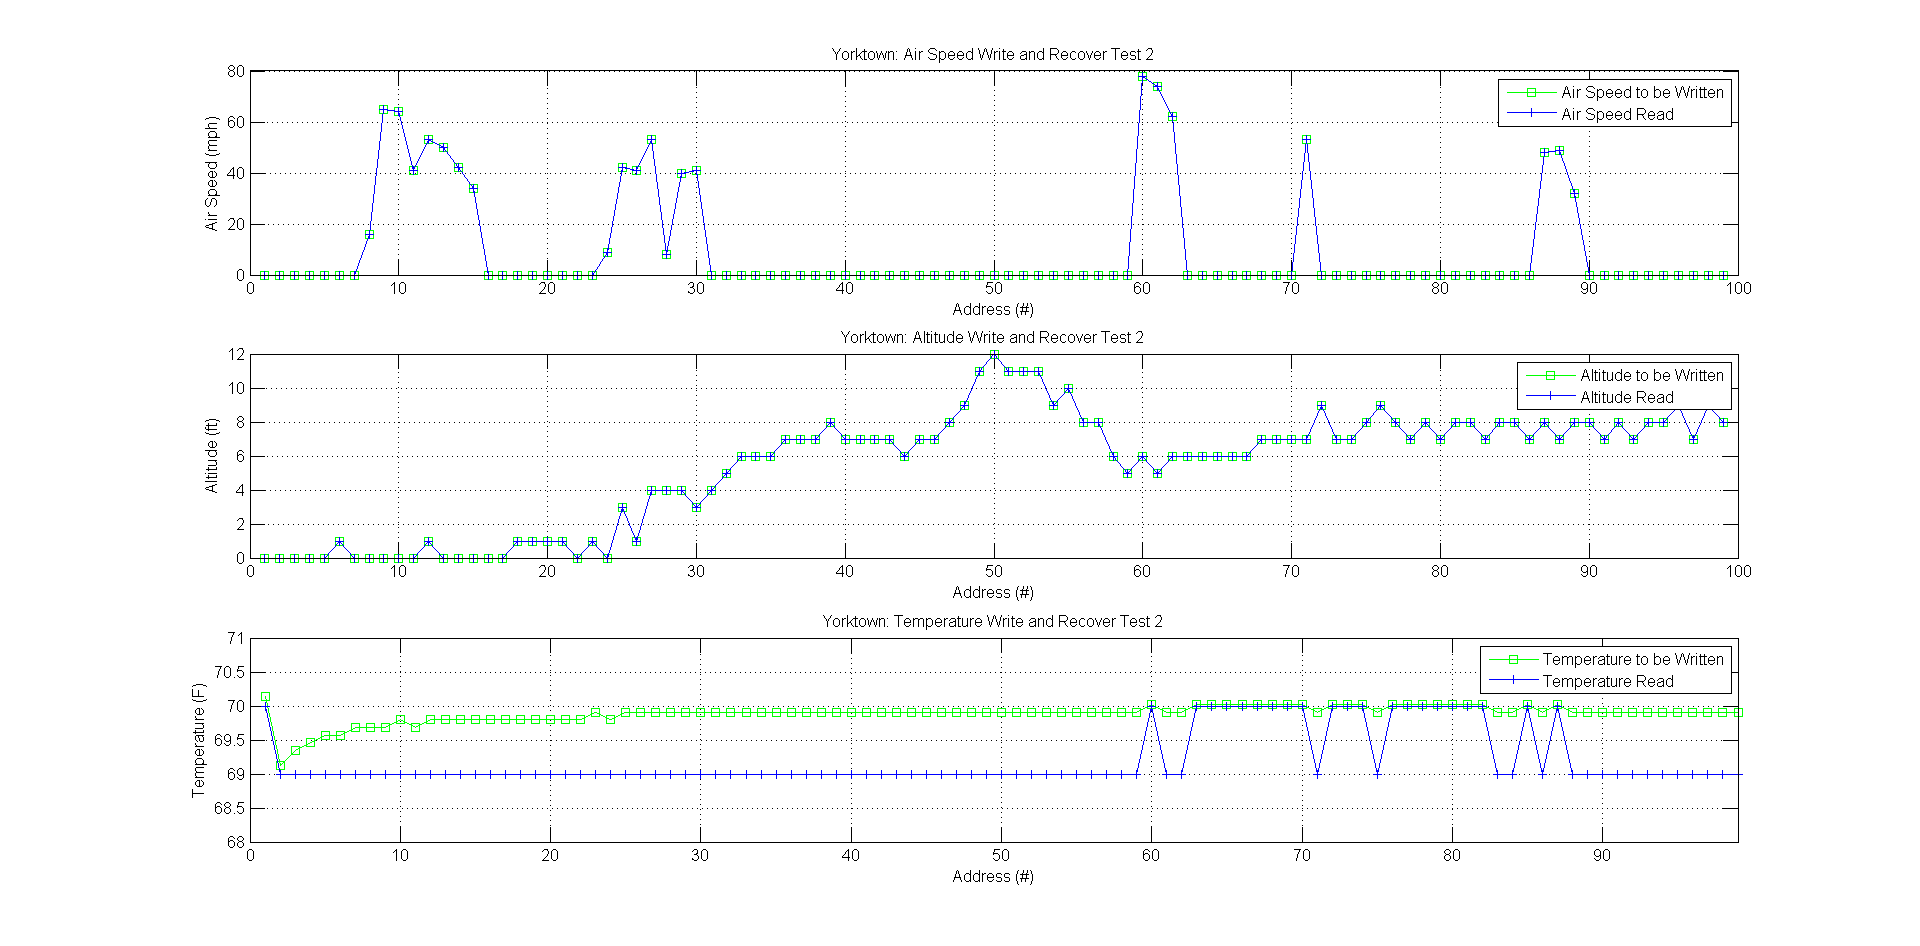
Figure 11: Full Yorktown test with air speed, altitude, and temperature.
Figure 12 shows an autonomous test of the Yorktown system. I connected the system to an external power supply instead of the computer and set it to record. This test shows an issue that I have encountered when running the system autonomously. The first data point of altitude recorded is used as the zero point for the tests. Then I usually add a threshold, in Figure 12 it is 50, to ensure that the altimeter never goes negative which would not be writable for EEPROM. But even when I zero out the altitude using this method the first two data points are extremely different, sometimes different by a 100 feet or even 400 feet. This is an issue only seen when the system runs on its own without a computer. I am still assessing this issue.
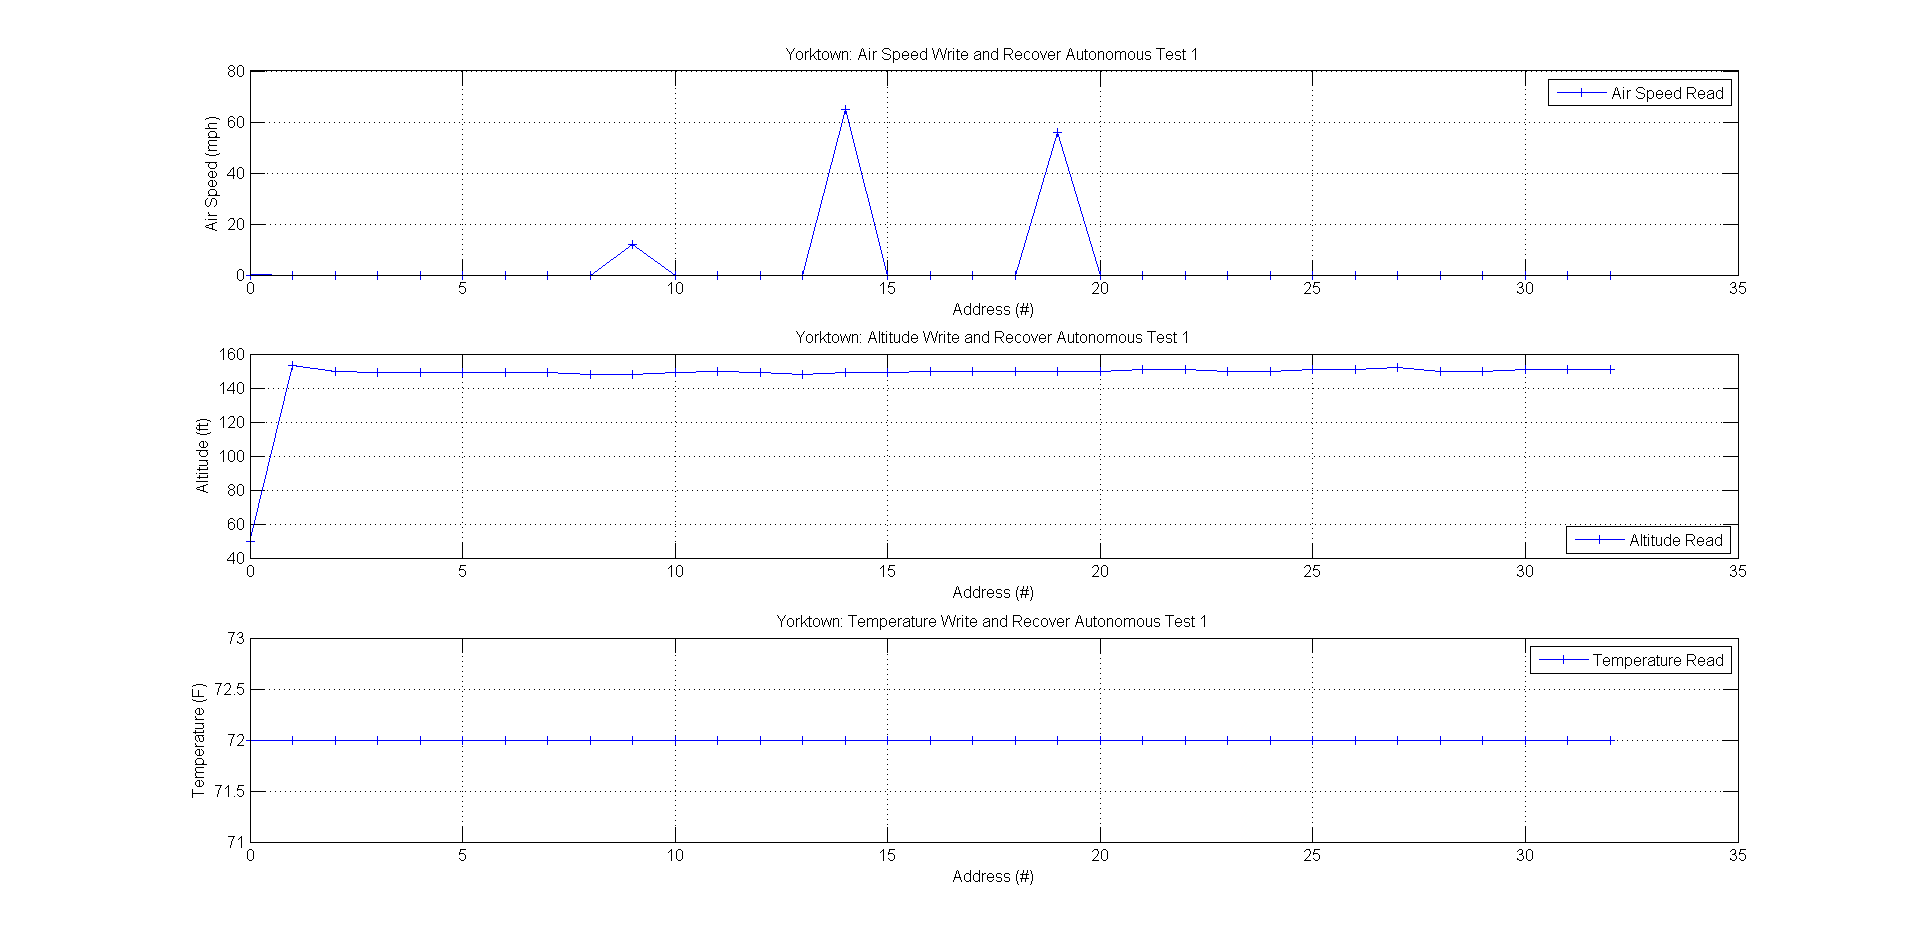
Figure 12: Yorktown autonomous test 1.
It was at this point that I set out to record the decimal places of the altitude. As described in the Yorktown Code/Process section I separated out the decimal portions of the altitude and Figure 13 shows this altitude data read in a higher detail than before because of the decimal places.

Figure 13: Altitude decimal places test.
The final Yorktown test was the stairwell test. For this test I walked up and down the stairwell at the end of the EE hallway. The stairwell is approximately 31 feet from the floor to the top of the third floor railing. Figures 14 and 15 show the results of these tests. I had to filter the data because of the first data point problem. Test 2 shows a max difference of 31.65 feet and test 3 shows a max difference 34.18 feet.

Figure 14: Yorktown stairwell test 2.

Figure 15: Yorktown stairwell test 3.
Yorktown Conclusions
My conclusions for the Yorktown system are mostly positive. I was able to get both of the sensors working with the Arduino Mega 2560 using the I2C protocol. I like using the I2C method. It is somewhat complicated to get starting in code; however, the circuitry is very simple and straightforward. Once the code works it is easily manipulated and configured to whatever system I need. Using the EEPROM to store the data is very simple; it is built well into the Arduino and is easy to retrieve. However, after seeing the Arduino Mega and my system work, I am now reconsidering my choice of microcontroller because I may need more than the allotted 4kB.
I have learned a lot about the Arduino and the I2C protocol. Testing the altimeter was at first stressful because of the drifting effects, but once I tested it in the stairwell I found that the sensor performs much better when it is actually moving around and not stationary (or at least it seems this way). Some days the altitude recorded is spot on with my altitude in the building (checked against GPS readings) and other days it is reading very negative values, but the sensor does well in practice.
The air speed sensor was easily integrated into the circuit and system and when I blow into the tube to simulate air flow it gives back results that seem accurate but have not been checked. From this Yorktown system I have learned a lot about design and testing. I am taking what I learned from this break so far and putting it towards my proposal for the next stage of the system, the Hornet.
Hornet Proposal
The Hornet system will use three sensors, two EEPROM chips, and the Arduino Pro Mini. The air speed sensor and altimeter will stay the same from the Yorktown, however, I will be adding a GPS sensor. This GPS sensor is called the Navigatron V2 and is built with I2C in mind. The EEPROM chips hold 256kbits each (8x larger than the Arduino Mega 2560).
The addition of two EEPROM chips will allow me to store 64000 bytes of information without using the Arduino Mega or Mini’s EEPROM. These EEPROM chips are I2C accessible, so they will join the I2C bus that the sensors use.
I am looking into RF transmitters/receivers now for the Hornet system. My concerns are with range and if the 434 MHz components can be dependable. They are very cheap, but I would hate to waste time with components that won’t work. I looked at a 315 MHz system but 315 MHz’s fifth harmonic overlaps almost exactly with GPS’ frequency, whereas 434 MHz does not.
In short, the difference between Hornet and Yorktown is that Hornet will have a smaller Arduino, 16x as much memory, a GPS, RF capabilities, and plug in connectors for each I2C component.
11/17/14 Update
11/17/14
This past week I ordered new parts in order to jumpstart the telemetry system. I determined that using the chipKit Max 32 board with the Eagle Tree air speed sensor was too difficult to continue devoting time to. Instead I have now order the Arduino Mega 2560 board and an altimeter that is known to work with the Mega. I have already found this code online and downloaded it. I verified (compiled) it on my computer using the Arduino IDE and it compiled successfully. I believe that it should be relatively easy to ‘plug and play’ once I get these parts. Then once the Mega communicates with the altimeter it should be simple to test the air speed sensor and determine if a new air speed sensor is needed or not.
Next I tried saving data to the board as if it was air speed data and I found that this process is actually straight forward. The chipKit Max 32, and the Arduino boards for that matter, have something call Electrically Erasable Programmable Read-Only Memory (EEPROM). This is a non-volatile memory and it can be written to and read from. I tested this by writing the number 12 to a couple addresses and then read this addresses. Therefore, it should be possible to store our information on the Arduino Mega in case we lose connection with the plane and we want to retrieve this data later. I found that the chipKit Max 32 board only had 512 addresses that could be written to, while the new Arduino Mega contains 4096.
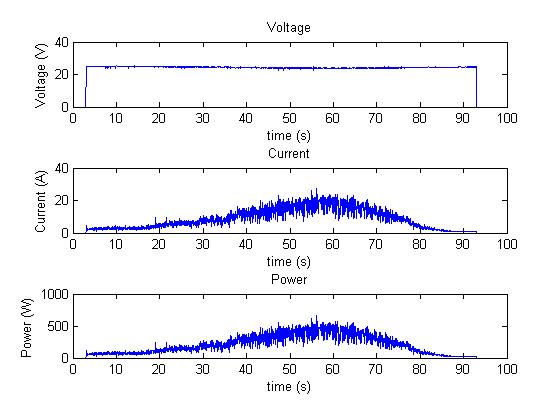
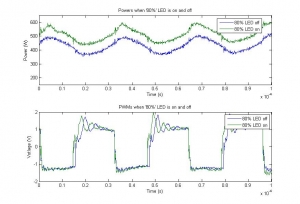
This week Ervin and I also used the new current probe and oscilloscope that John lent us from Professor Hedrick. We used this first to collect a simple 100 second reading (Appendix A). This showed us just how bouncy the current and power really are. Voltage also dips a little bit but it isn’t really all that important since it is practically a constant. However, we do see that our power can, in 0.04 seconds, jump about 100 Watts and then back down. This gives us some perspective as to just how noisy our system can be.
Next we soldered two connections onto the limiter. We put two wires across the ‘80%’ LED and connected these to the oscilloscope channel 3 using a coaxial cord. This allowed us to measure the voltage across the LED and what we found was rather interesting (Appendix B). Over a 100 μs range, we saw the PWM over the LED. We saved two tests, one right before the LED began to blink, and one right after the LED became solid. There is a clear difference between the PWMs and a difference of about 1 μs in width. We also found that the LED, what we have called the ‘80%’ LED, is solid when our power is peaking around 600 Watts. Next maybe we will try and measure the ‘90%’ LED and see when that LED begins to blink and then hopefully we will have a better understanding of what actually trips the limiter and for how long we can trip it before it limits us.
Lastly I filled in more details on the block diagram (Appendix C). My goals for this next week are to continue using the current probe with Ervin and wait for my camera and microcontroller parts to arrive. Ervin and I should be able to determine more about the limiter and how long we have above 1000 Watts before it cuts our power.
Appendix A
Appendix B
Appendix C
11/10/14 Update
11/10/14
This past week I calculated the amount of information that could be collected during one flight duration. I found that at 5 readings of air speed, altitude, and GPS per second I collect 10500 bytes during a 5 minute flight (see table at end).
I also found that the Max Chip Kit 32 board that I am using is practically an Arduino and should be able to be used as one. “…supports the original Arduino™ line. Compatible with many existing Arduino™ code examples, reference materials and other resources.”
This being said, I still have not been able to get the air speed sensor working with my Max32 board using the I2C method. From what I have so far I am not sure what is wrong with the device, I tried to update my Wire Library (which was what I thought the problem was) but that did not work. When I try to read data from the air speed sensor I get 0 bytes read. Because of this, I have reached out to Professor Traver for help because she has some experience with both this method and board. But she is out of town until Wednesday this week.
I ordered the camera, transmitter, and receiver this week and those should be here soon. Lisa placed the order on Friday. I found that the camera’s field of view is 100˚ and through some simple geometry I think we should place the camera at a 10˚ downward angle. This way at the bottom of the camera image we can see directly below the plane. And the wide angle allows us to still see the target in front of the plane.
This week Ervin and I also tested the new 6 cell battery and achieved 999.6 W and we tripped the limiter finally. However, after this the battery died. When we tried to charge the battery we found that the charger did not recognize the 6s battery and so we did not charge it.
This week I plan to meet with Professor Traver when she returns and we should be able to figure out what is wrong. Once the air speed sensor is working I will order an altimeter and GPS sensor. This way I know that I can get them working using I2C. Professor Bruno also asked me to look into accelerometers to measure the forces on landing and also if there is a way to know exactly when our wheels come off the ground during takeoff.
(Where I am)

| Flight time | 300 | seconds |
| bytes/read | ||
| Air Speed | 2 | bytes/read |
| Altimeter | 2 | bytes/read |
| GPS | 3 | bytes/read |
| Reads/second | ||
| Air Speed | 5 | |
| Altimeter | 5 | |
| GPS | 5 | |
| Total | 10500 | bytes |
| MAX | 128000 | bytes |
11/3/14 Update
11/3/14
This week I learned all about I2C protocol. I2C protocol, or inter-integrated circuit, uses a master/slave combination to talk to multiple sensors from one master. The master being a microcontroller for example. At first I tried to find a way to use sensors without I2C, however, as I looked I found that more and more sensors actually used I2C and that there were a lot of resources online for help. For example the air speed sensor I am using now uses I2C. And the altimeter from Eagle Tree (that is missing) also does.
I have not yet gotten the air speed sensor to work using I2C but I think that this is the right path since I keep finding more and more information on I2C. One problem I just ran into is that my “wire library” is outdated. I’m not exactly sure what that means or why it is outdated. But the wire library has to do with my code being complied and once I update my wire library (working on it) I should be able to start actually testing my code.
This week I would like to purchase some components (details and links at end). Including an altimeter, camera, and transmitter/receiver. The altimeter is small, using I2C, has a detailed datasheet, and example code with ardiunos.
The camera, Airy 3g Mini Camera, is only 3 grams. It is used by a lot of drone hobbyists and also recommends a transmitter/receiver combination (Boscam 5.8Ghz FPV System (TS352 TX + RX305 RX / 500mw)). The transmitter does need 11.1 V and is 55 g (0.12 lbs).
In terms of GPS components I am still looking. I’ve found that it is hard to pick one because they all have so many different specs. Finding one isn’t the problem, it is picking it. So far I am favoring the GP-635T because of its fast (1-5Hz) update times and its large amount of channels (fasting locate time). It is also really small and can be powered by a 3.3-5 V source with a 56 mA current draw.
I have also looked at on board data storage for the microcontroller. I believe that it has 128k of SRAM data memory which can be used for storing the sensor data on the board. I am concerned about the GPS data requirements. From what I have read it seems that the GPS could quickly use up the storage space within the SRAM so that is something to continue researching.
All in all I think I2C is the way to go for programming the board and the related sensors. I’m not sure how the GPS connects to the board. The GP-635T says something about TTL connection.
My goals for this week are to fix this weird wire library issue and then get the air speed sensor running. Once it is running I’ll know I can use the I2C protocol and can order the altimeter.
| Altimeter | $9.95 |
| Camera | $69.90 |
| Transmitter/Receiver | $139.90 |
| Total | $219.75 |
| Total +15% (Shipping/Tax Estimate) | $252 |
GPS $39.95
10/27/14 Update
10/27/14
Last week I fixed my MATLAB code that doesn’t use forces. I found that our ground speed will have a great effect on the lead distance than the altitude. Several figures are below from the script.

Altitude varying slope: 0.492
Ground Speed varying slope: 3.67
Varying ground speed has a larger impact on the lead distance.
I started writing the code for the microcontroller and found that I have to use a serial peripheral interface (SPI) technique. Since I am not familiar with SPI, I have been doing some reading and checking examples online.
Ervin and I also connected the test bed set up to an oscilloscope. We were able to measure voltage of the battery, however, this does not tell us much without the current.
My goals for this week are to interface the microcontroller and air speed sensor using SPI and include forces in the MATLAB script.
Recent Comments