Wildlife Populations

In the World Wildlife Fund’s 2016 Living Planet Report, the organization reported that there was 58% decrease (.42 decay factor) in the populations of vertebrate animals from 1970 to 2012, such as mammals and birds. The terrestrial population decreased by 38%, a .62 decay factor. Even more alarmingly, WWF found that the populations of freshwater animal species decreased by 81% (.19 decay factor) from 1970 to 2012. These numbers are equally shocking and terrifying to me. Only 19% of the 1970 freshwater animal population still remained in 2012.

What is the reason for these extreme drops in animal populations? The World Wildlife Fund gives us 4 main reasons why this has occurred. First, habitat loss and degradation as a result of commercial and residential development. Second, our food systems have a negative impact on the natural world, such as overfishing. Third, climate change requires animals to adapt to different environments, damaging reproductive cycles and migration timing. Finally, species overexploitation harms animal populations. Sometimes this is direct and intentional, such as with illegal hunting, and other times it is unintentional, such as catching one type of fish when you meant to catch another type.

People should stay away from wildlife crime, it is both wrong and unsustainable. In addition, everyday changes we can make to our lifestyle to prevent climate change can help stop this massive decrease in animal populations.

Tiger Populations in India, After a Long Decline, Are Finally Coming Back

Everyone, at some point in time, has named the tiger as their favorite animal, and apart from being stunning and fascinating creature they are far more important then just as a beautiful animal. An obvious benefit to the existence of the tiger is the fact that, as a major predator, they maintain balanced ecosystems within their own habitats. Another less apparent benefit is economically, since tigers are mainly found in large numbers in areas with high poverty rates, such as India or Nepal, the presence of larger numbers of tigers will eventually lead to a tourist trade. This new tourist trade can benefit small businesses in rural communities and provide a greater flow of currency through these areas.

India conducts a census of tiger population every four years, and there latest census for 2018 is set to be released in January of 2019 with tiger numbers estimated to cross over the 3,000 mark. As of 2014 the tiger population was set at 2,226 tigers left in the wild, up 520 from the 2010 number of 1706, which marks the first time that tiger populations have been steadily increasing in one hundred years. The growth factor, just using those most recent values, comes out to around 1.30 with a percentage change of 30.5%, and a rate of change of about 130 tiger increase per year. Strictly looking at these values of exponential growth the 2018 census numbers may fall short of the 3,000 estimation around 2,894 wild tigers. The most recent worldwide numbers for tiger population stand around 3,890.

Decay of Coral Reefs

Coral reefs are vital ecosystems not only for the sea, but for coastlines as well. You may have heard the term “barrier reef”, such as the Great Barrier Reef off the coast of Northern Australia. This term is far more important than you might think though. Barrier reefs are just that; barriers. For thousands of years, these barrier reefs have protected coastlines from storms, eroding seashores and sea cliffs and kept beaches stocked with sand. They also kept fish, sea plants and other sunlight- needing animals safe and provided with all the food and habitat that they need to survive. This has also helped coast-dwelling peoples survive sustainably by fishing and harvesting sea plants to eat. However, coral is a complicated creature because it is made up of both a plant and an animal; both of which are dependent on one another for survival. If you have seen coral, I am sure that you have seen coral that is vibrantly colored, and coral that is light tan or even completely white. This is the leading sign of decay in coral.

The term for this decay is coral bleaching. It is the number one killer of coral reefs because once a coral polyp begins the process, it does not grow back and it spreads throughout the entire colony. Coral bleaching is devastating coral reefs and the ecosystems that they support. As I mentioned before, coral is extremely complex. A single coral polyp is made up of 2 components: the animal and the plant. The animal (polyp), which keeps the coral alive and builds its hard, protective outer casing or calyx, is like a tiny little anemone that has tentacles and collects food molecules from the water and brings it into the stomach. The plant part is an algae called zooxanthellae. The zooxanthellae is what gives the coral it’s color and zooxanthellae supply the coral with glucose, glycerol, and amino acids, which are the products of photosynthesis. The coral uses these products to make proteins, fats, and carbohydrates, and produce calcium carbonate. They then use the calcium carbonate to make their protective calyx. Unfortunately, when coral polyps become stressed, by something as small as a snorkeler touching it or something as damaging as dynamite fishing or global warming, it expels the zooxanthellae. The coral then is no longer able to maintain its calyx and loses its healthy color. In these cases, the polyp will always die and it will take its neighbors down with it. Bleaching coral is dying coral and coral is very sensitive; a person can kill an entire colony of coral (approx 150 years of growth), simply by touching it or trying to take it home as a souvenir.

The demise of coral reefs is having a catastrophic effect on the terrestrial and marine ecosystems that they serve and protect. Global warming and the rising water temperatures are the number one cause of coral bleaching. According to a study from the Global Change Institute at the University of Queensland in Australia, the problem is only getting worse.

Image result for coral reef decay graph

Live coral populations are declining rapidly and sadly, they will never grow back if we keep polluting the oceans and the climate keeps rising.

Rabbit Island

A small island off the coast of Japan became famous after videos of visitors being swarmed by rabbits were released online. These videos of dozens of rabbits on this island quickly went viral and begun a long list of rumors to how the rabbits first came to the island. Some say a British couple brought them decades ago, others say the rabbits are offspring of animals that used to be on the island for chemical weapon testing, although experts insists those animals were all euthanized. Although how the rabbits got to the island may be in question, they have managed to increase their population by over 30% in the last 11 years.

The fame of these rabbits brought tourists from all around the world to the island. In 2005 the island had 136,000 visitors which increased to 254,000 in 2015. This is an average increase of 11,800 tourists per year.

In general, the population keeps growing, but in the article I read by national geographic, individual rabbits are suffering. The rabbits are depending greatly on the humans to feed them, however the food tourists usually bring is actually harmful to rabbits in large quantities, like cabbage. Rabbits are also frequently run over by the vehicles on the island and suffer health issues related to human contact.

However, because the people on the island have been able to coexist with these rabbits, Takashi Seki at the Ministry of the Environment says that artificial intervention with these rabbits is “undesirable,” although it will be interesting to see how the increasing rabbit population affects the ecosystem of the island in the next few years.

Panther Population in Florida

Florida is a unique state to say the least.  It’s a place that’s brimming with various different plants and animals, and has many conservation areas of great beauty such as the everglades.  At the same time Florida is also in a constant state of development, as construction of shopping malls, housing, and retirement communities begin to fill up the state.  Coupled with this is the large number of tourists and vacationers that come to the state every year seeking sunshine.  All of this has impacted the wildlife and ecosystems of the region.  One animal that is currently endangered is the Florida panther.  Back in the 1970s and 80s when people were less environmentally conscious, the Florida panther population dropped down to around 20 or so.  It was estimated by the U.S. Fish and Wildlife service in 2017 that there were between 120-230 panthers.  The panther population has risen thanks to concerted efforts by conservationists to keep the panthers around, however, they are still severely endangered.

For clarity, let’s say that the population was 20 in 1975.  Let’s also say that the 2017 population was 180.  This is an obvious increase of 160 panthers over 42 years.  If we divide 160 by 42 we get the rate of change: 3.81 new panthers every year.    If in 1976 there were 23.81 panthers (up from 20 the previous year), then we can divide 23.81/20 for find the growth factor and percentage.  The growth factor is 1.1905 and the percentage increase in panthers per year is 19%.

It’s hard to believe that the panther population will soon skyrocket, but with careful study and effort, the population could likely go back up to a steady level.  This link highlights some of the dangers panthers face, and partially explains why there are so few of them.

Population Growth and Deforestation in Guatemala

The article that I chose to use looked at population growth and deforestation in Petén Guatemala. The population in 1960 was about 21,000 people and has risen to 600,000 today, which is over a 10% growth each year. This drastic rise in population forced the new citizens to find new land to survive. In Petén, the process of deforestation was designed to meet the new growing populations needs, but this process of removing trees will have a lasting effect on the growing population. This process of relocating people also made it extremely difficult to provide consumer goods, infrastructure, and health services. Without these necessities, families were being hurt due to the massive influx of new people.

Ultimately, the country will run out of room to house these people and will certainly create a rise in deaths. Countries should focus more on feeding their people while working within the natural environment rather than destroying the environment. Soon there will not be any naturally occurring forests and humans will be to blame, hopefully we never get to that point because it may be too late.

Plant-Based Foods vs Animal-Based Foods

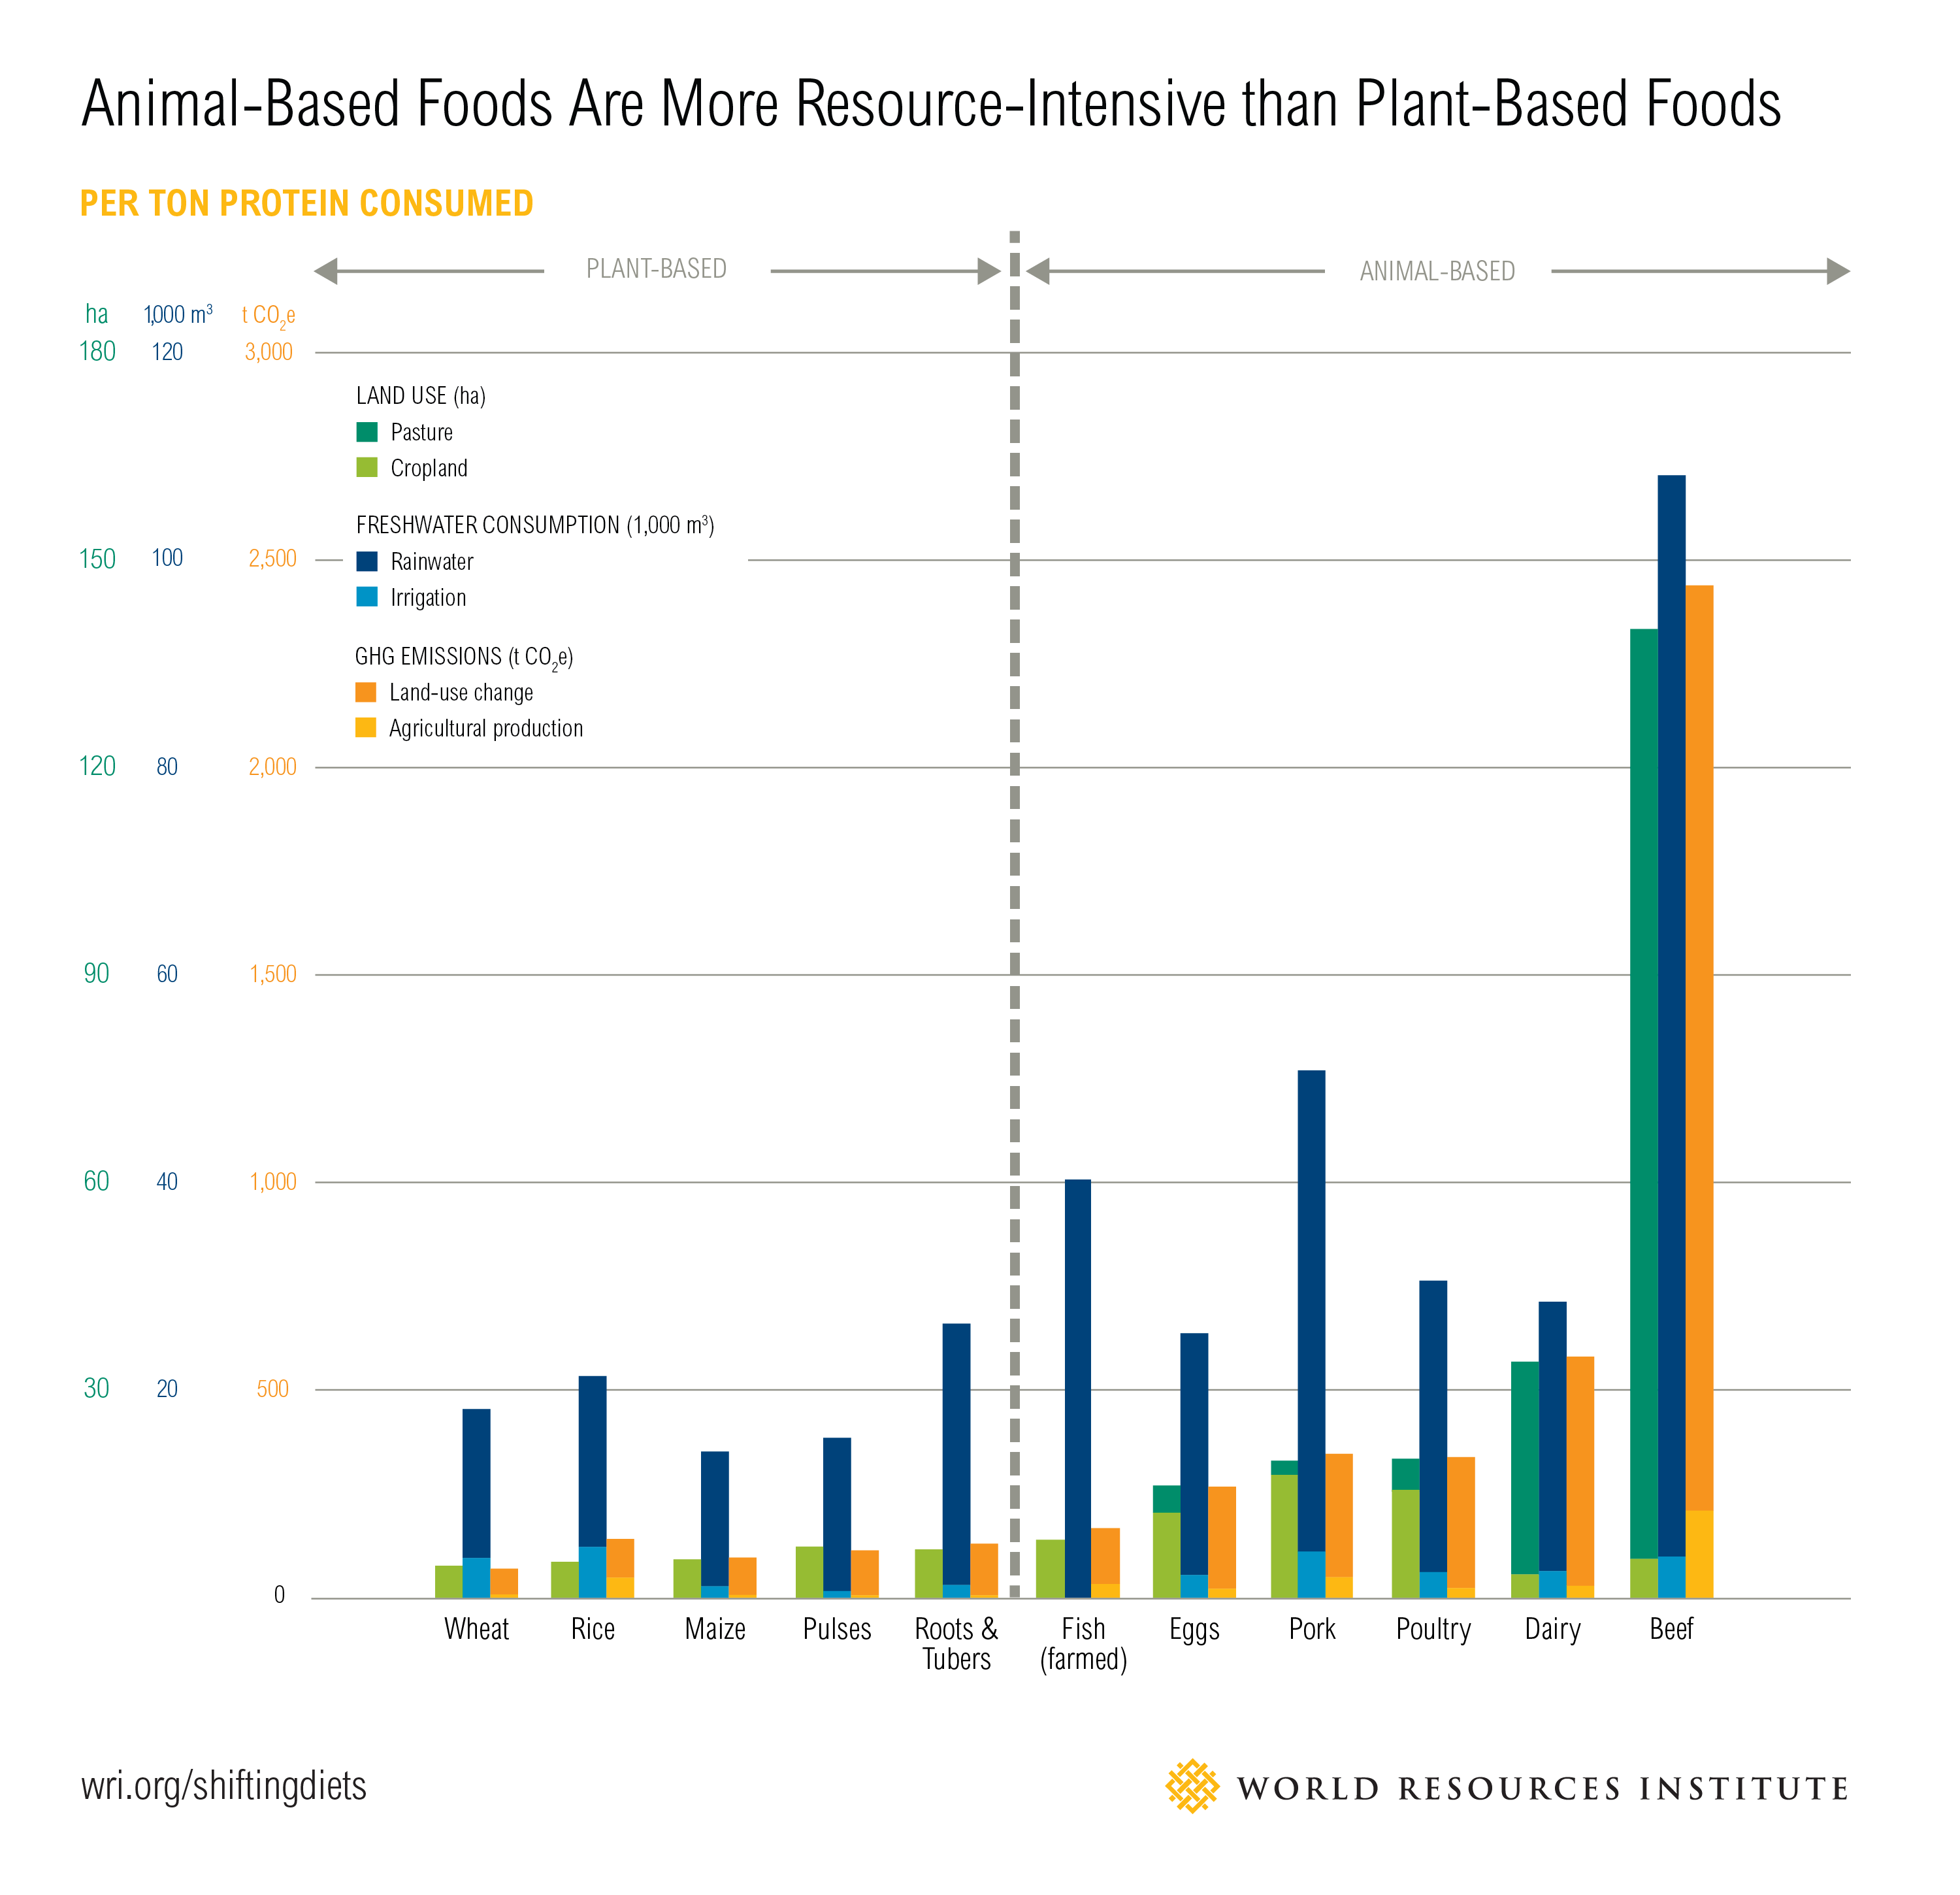
The production of animal based foods is an issue we have been discussing in class for the past few weeks and this chart helps break down consumption of meats and vegetables. The chart shows the required land, water consumption, and GHG Emissions for produces like wheat, rice, eggs, pork, and beef. The charts are higher when it comes to the consumption of meat as it takes more resource to cultivate. Producing animal-based foods is responsible for more than three-quarters  agricultural land use around the world. The amount of land it takes to raise cattle is neisse compared to the land needed for agriculture. The resources that would be used on agriculture would not only be cheaper but have more benefit for everyone. Agriculture’s production-related greenhouse gas emissions is less compared to that of meat related consumption because of waste in resources. Because many animal-based foods rely on crops for feed, increased demand for animal-based foods widens the food gap relative to increased demand for plant-based foods.

Population Growth and Sustainability

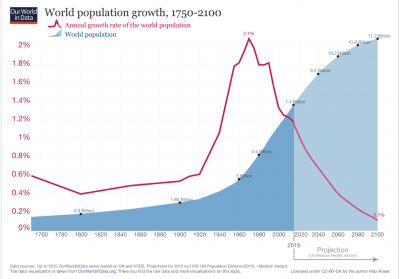
For my data selection, I chose to examine world population graphs. Below, we see the graph of the changing population from 1750 to the projected population in year 2100. The red line that we see in this graph shows the annual growth rate of the world population. This line expresses how growth was relatively between .4%-.6% from 1750 up through 1930, but after the baby boom post WWII, population growth shot up exponentially. Now, with less people having babies and the population is unable to replenish itself, population growth is now slowing at an exponential rate as well. There are several reasons for this–more women are joining the work force and are either waiting to have kids, having less kids, or not having kids at all. Some women choose not to have children at all due to their perception of the world in its current state, which is something I learned from my political science class this past spring. The other curve seen on this graph is the blue curve of the world population. The dark blue shaded in section represents the actual population growth from 1750 up to 2015. The lighter blue shaded in region represents the projected population growth from 2015 up to the year 2100. The population is still increasing, but at a much slower rate than in the past, which is why the slope of the projected population growth is much less steep than the slope of population growth from 1945 to 2015. This relates to sustainability because our current population growth is not sustainable for our Earth. This is partially due to the amount of food we need to grow to feed this giant population, and the amount of land that we need but do not have to efficiently grow food on (not all land is good for growing crops). This also relates to my research from last week discussing the problems with eating meat, as this population size is not sustainable for having humans be able to consume meat (which the practice of raising the meat in itself isn’t sustainable as well).

Link to article here.

Sustainable Waste

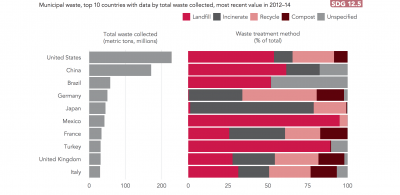
The Atlas of Sustainability publishes data from around the world about environmental sustainability. Above is a chart of the top 10 countries with the most municipal waste, how much waste is collected, and where that waste goes. The United States is responsible for the most total waste collected, totaling over 200 million metric tons of municipal waste. Out of the waste collected in the United States, over 50% (52.7%), more than 100 million metric tons, ends up in landfills in the year 2014. 12.8% of waste in the United States was incinerated. In the year 2014, only 25.7% of waste was recycled in the United States, and only 8.7% of waste was composted.

When waste ends up incinerated or in landfills, it can have negative environmental impacts. Landfill waste is responsible for greenhouse gas emissions of both carbon dioxide and methane. When waste is burned, these greenhouse gases are also emitted into the air. In addition to air pollution, landfills also account for groundwater pollution. When it rains, hazardous chemicals dissolve and collect at the bottom of landfills. These chemicals dissolve into the ground, polluting the ground and soil.

When we recycle, we save waste from ending up in these landfill facilities and are able combat environmental damage. In order to reduce our negative environmental impact, Americans should make an increased effort to dispose of their lifestyle waste through recycling or composting. This way of disposal is far more environmentally friendly, and not very difficult to practice.

U.S Consumption of Beef

Since posting last week about the water footprint of beef, I have not been able to get it off my mind. I took this week’s post as an opportunity to go a bit more in depth about the consumption of beef in the United States. An article I found discusses the shift of Americans from beef toward chicken consumption.

The graph shown below displays the peak of beef consumption in America during the 1970s, through the current decline of beef consumption per capita. During this 17 percent decline of beef consumption, greenhouse gas emissions decreased by 10%. As we can see, pork and poultry consumption have relatively stayed the same throughout this period of time. Though this means more chickens are being eaten, reducing the amount of beef consumed proves crucial to reducing our carbon and water footprint.

The article goes on to explain that the production of beef emits seven times the amount of greenhouse gases than chicken. Further, the carbon and water footprint of beef is roughly 20 times that of plant-based foods like beans.

The next graph shows that the production of chicken has increased by 5 times, while beef production has stayed consistent. This is partly due to the high demand for cheaper meats like ready to cook chicken. Beef takes longer to cook, making chicken an easier everyday option for most Americans.

Lastly, we should touch on America’s dietary footprint. Though we have decreased our consumption, beef still accounts for almost half of our dietary footprint. The final graph shows that American consumption of beef is not only one of the highest in the world, but actually four times the world average.

These trends all point to one thing: reducing our production and intake of beef will substantially decrease our carbon footprint within a single generation.