Social Justice and Voting for U.S. Presidential Elections

I see voter turnout as a social justice issue. Voter turnout has consistently stayed between 45 to 85% of the voting age population in the United States. Voter turnout has clearly correlated to social justice issues, including who is allowed vote, who can afford to leave work to vote, and who feels politically empowered enough to vote. We see large dips in voter turnout prior to the great depression, as well as in the early 2000s around the recession and around the recession in the 1980s. Whenever there are poor economic times, we see dips in voter turnout. We also see dips in voter turnout when the population has less confidence in the government– this is especially true for during and post Vietnam war era United States.

Another social justice issue related to voter turnout for presidential elections is the fact that those who are financially disadvantaged tend to not be allowed to leave work to vote within voting hours. This is an issue that has been combatted by other countries including Australia, which enacted mandatory voting legislation in 1918 and has imposed fines on those who do not vote. However, since voting is not mandatory in the United States, not all employers let their employees leave work to vote. Since the United States does not have mandatory voting laws, we can attribute many changes in voter turnout to social justice issues.
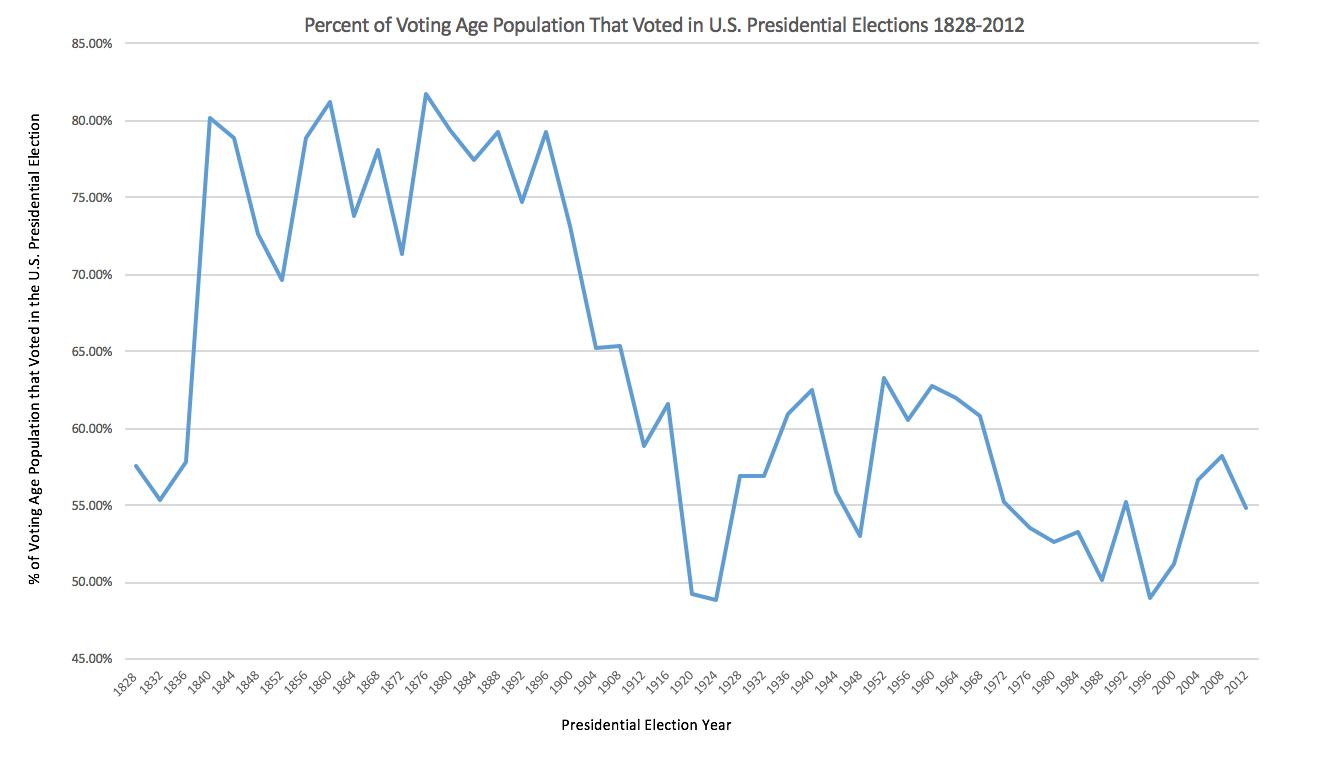
 

Link here to data.

Population Growth and Sustainability

For my data selection, I chose to examine world population graphs. Below, we see the graph of the changing population from 1750 to the projected population in year 2100. The red line that we see in this graph shows the annual growth rate of the world population. This line expresses how growth was relatively between .4%-.6% from 1750 up through 1930, but after the baby boom post WWII, population growth shot up exponentially. Now, with less people having babies and the population is unable to replenish itself, population growth is now slowing at an exponential rate as well. There are several reasons for this–more women are joining the work force and are either waiting to have kids, having less kids, or not having kids at all. Some women choose not to have children at all due to their perception of the world in its current state, which is something I learned from my political science class this past spring. The other curve seen on this graph is the blue curve of the world population. The dark blue shaded in section represents the actual population growth from 1750 up to 2015. The lighter blue shaded in region represents the projected population growth from 2015 up to the year 2100. The population is still increasing, but at a much slower rate than in the past, which is why the slope of the projected population growth is much less steep than the slope of population growth from 1945 to 2015. This relates to sustainability because our current population growth is not sustainable for our Earth. This is partially due to the amount of food we need to grow to feed this giant population, and the amount of land that we need but do not have to efficiently grow food on (not all land is good for growing crops). This also relates to my research from last week discussing the problems with eating meat, as this population size is not sustainable for having humans be able to consume meat (which the practice of raising the meat in itself isn’t sustainable as well).

Link to article here.