High School Dropout Rates by Family Income 1972-2001

According to Radical Math, the graph below shows high school drop out rates of students aged 15 to 24 by family income from 1972-2001 for grades 10-12 in the United States. This study was produced by the United States Department of Commerce. Low Income is categorized as an income in the bottom 20% of all family incomes, middle income is categorized as a income between 20% and 80% of all family incomes, and a high income is categorized in the the top 20% of family incomes.

This graph shows that within families of lower income there are higher drop out rates compared to families with middle and low incomes. In 1972, the drop out rates among low income families was 14.1% while the drop out rate was 2.5% for high income families. In 2001, the drop out rate for low income families was 10% which decreased from 1972. In 2001, for high income families the drop out rate was 1.7%. According to this article by American Psychological Association (APA), the United States is currently in a drop out crisis. Their data in 2012 shows that 1.1 million students in the graduating class did not receive a high school diploma. Their reasoning for this is the adverse toxic stressors that are put on these students ultimately affecting their behavior and health. There is a need for solutions to improve the high school drop out rates.

Negative Impacts of Gentrification in Brooklyn

The process of gentrification in urban areas can have a disastrous effect its inhabitants. The process refers to a physical, social, economic and cultural phenomenon whereby urban neighborhoods are converted into more affluent communities resulting in heightened property values and the discharge of low-income families. Gentrification happens not only all over the United States, but all over the world.  On my term abroad in Washington, DC this past spring, we witnessed gentrification in its prime—we saw nicer, new buildings being constructed in a poverty-ridden area.

Due to the construction of new buildings, the area becomes more expensive to live; rents rise, and therefore, impoverished people cannot afford to live there any longer.  They are forced to leave.  This process, gentrification, changes areas drastically over the course of several years.

The article I decided to analyze from RacialMath looks into gentrification of Brooklyn, New York.  The article, Who Hurts, by Ben Gibberd published in 2005, looks deeper into the personal problems of individuals being directly influenced by the gentrification in the area. Gibbered explains the new attractiveness of the area, and how it draws wealthy, middle-high income individuals to the area. From there, displacement occurs.

An interesting story from the article is of Ms. Anaya.  She resides in an overcrowded two-family home, living with her parents, brother and twelve other tenants.  The twelve other tenant include multiple children under three years old in just the upper-floor of the apartment alone. She explains the poor condition of the apartment, explaining that ”there’s a big hole in our bathroom, and hardly any heat.” And, her parents pay $1,000 a month in rent.

However, even though Ms. Anaya and her family want to move out—they cannot. Due to gentrification issues, they cannot afford a new place in Brooklyn.  She illuminates these problems by saying, “”Everything’s $725,000,’ and that’s on a bad block.”

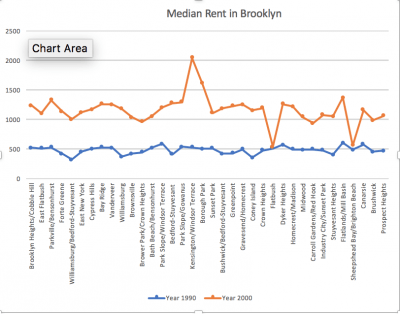
The issues raised in this article led me to another article posted on the RacialMath site. This article looks at the changes of rent from 1990 to 2000. I made a graph to show the increase in rent during the ten-year span.  Due to the large increase between these two years, we can only imagine how high the rent is today in Brooklyn, 18 years later.