Lessen you CO2 emissions by walking!
2

My idea is to apply for a grant in order to fund research about the cost/benefit of green renovations to the residence halls. This is important because while the administration and trustees may think renovations are not in the budget, it could save money in the long term. This research would focus on assessing how long it would take for certain renovations to pay back themselves and be more cost-effective than just maintaining the current system. The main renovation that I think is important is a new heating system because that seems to be an area that generates a lot of unnecessary energy. If we could show the board concrete data supporting that renovations such as these will save the school money, they may be more likely to dedicate funds to such a project. This would benefit this school, the environment, and the students’ quality of life.
In my last post, I created figures depicting the overall trends in the general federal prison population as well as these trends broken down to account for different types of offenses. I was especially intrigued by the information on the prevalence of drug offenses leading to incarceration from 1990 to 2014. From looking at the graph, it is clear that the drug offenses have accounted for the greatest proportion of crimes leading to incarceration on the federal level. The green line used for this offense on the graph stands out and reaches much higher than the other ones. It is also clear from looking at this figure that the most significant increase in drug offenses was at the beginning of the figure, from 1990 to 2000 and it seems to level off somewhat from 2000 to 2014. Due to this interesting trend, I did calculations to specifically quantify the increase in drug offenses during this time.
I first focused on the time period of 1990 (31,300 inmates) to 2000 (74,276 inmates). During this time, there was an overall increase of 42,976 federally incarcerated drug offenders, therefore the number increased by an average increase of about 4,297 inmates per year over these 10 years. This means that the number of drug offenders increased by 137% from 1990 to 2000 and increased by about 13.7% each year during this time period. This is a huge increase from both the 10-year unit perspective and when it’s broken down into yearly increases. An increase of 137% overall means that the number of drug offenders in 2000 increased by double plus one-third of the population in 1990.
I also examined the period of time where these numbers seemed to level off. Often, when you see a graph level off after a large increase or decrease, it appears stable and resolved at first glance. But, a seemingly stable line could still indicate a significant change. Between the years 2000 and 2014, the number of drug offenses increased by a total of 21,524 people and over these 14 years there was an increase of 1,537 offenders each year. This indicates an increase of 2.1% per year over these 14 years. This seems like a minor change that may not be important, but when you look at the total increase, the impact appears much greater. This 2.1% yearly increase led to a 29% overall increase in drug offense incarcerations from 2000 to 2014. Although this increase is not as dramatic as the increase between 1990 and 2000, this still accounts for almost additional one-third inmates incarcerated for drug offenses which is pretty significant.
When the time is taken to further analyze graphs such as this one, it increases the understanding of the magnitude. While an almost straight line might suggest stability at first glance, further investigating the relationship results in a more thorough understanding.

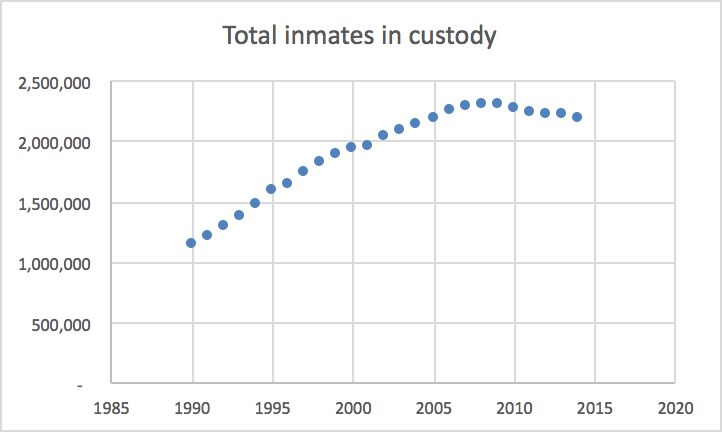
I chose to create two graphs that illustrate the growing prison population from 1990 to 2014. The issue of mass incarceration is extremely prevalent at the moment. One of the institutions of the United States which begs for significant reform is the criminal justice system. With the US being the countries with the most prisoners per capita, it is clear that efforts need to be made to reduce these numbers. I created the following graph depicting the overall rise in the prison population. You can see that the number of total inmates rises somewhat steadily from 1990 to about 2007 and then begins to level off approaching 2014. While it is positive that the population has stopped rising so quickly, it is important to make efforts towards decreasing the number of people in prison more rapidly as well.
The following graph depicts the rise in the prison population by the offense. This graph depicts drug offenses a the most common and fastest growing reason that people go to prison. While property offenses, violent offenses, and other seem to have remained consistent over time, drug offenses as well a public order defenses have clearly risen. I am not surprised by what is shown about drug offenses due to the recent movement to decriminalize more minor drug offenses. This seems like it could be an effective way to decrease the overall prison population because drug offenses make up the greatest portion of prisoners in the system.

Clearly, plastic contributes to a large portion of the humans waste that pollutes the environment. Although we are told to reduce, reuse, and recycle, much of our plastic is disposed of improperly and ends up in places where it has the potential to cause great harm, such as the ocean.
The graph I chose details the portion of plastic trash that is disposed of improperly as well as the portion of that plastic that ends up in the ocean. In 201o, 275 million tonnes of plastic trash was produced. Of this 275 million tonnes of total plastic waste, 31.9 million tonnes were disposed of improperly and, therefore, 243.1 million tonnes were disposed of properly. Although at face value it seems like this means we’re doing pretty well with recycling, when I calculated the percentage I discovered that this means 11.6% was disposed of improperly and 88.4% was disposed of properly. This means more than 1 in 10 articles of plastic waste were not recycled, which gives these stats perspective and shows that we are really slacking on recycling. Additionally, of the 31.9 million tonnes of improperly disposed plastic waste, 8.75 million tonnes ended up in the ocean, which is 27.4% of the improperly disposed of plastic and 3.2 percent of all plastic waste.
By further interpreting graphs such as this one, it is possible to gain a more comprehensive perspective on the real meaning behind the numbers and what they really mean.
A current environmental issue that is facing us today is how to control the rising levels of CO2 in the environment. CO2 levels have been increasing at a record rate, with the levels raising to 400.83ppm in 2015. This was an increase of 3.03ppm from the previous year, making it the first year that CO2 raised by more than 3ppm. Now, as of yesterday, the current CO2 levels are 405.19ppm. There is clearly a need to be concerned about the future of CO2 levels and a need to determine ways to slow their rising levels and begin to decrease the levels over time.
One idea that has been considered by scientists comes from the knowledge that trees consume CO2 in order to grow and, in turn, remove some CO2 from the environment. Additionally, they emit much-needed oxygen into the environment. In order to test the theory that trees may suck up CO2 and make strides in cleaning the atmosphere, scientists created a model environment that aimed to replicate the high CO2 levels that are inevitable in our future. They sprayed 2 tons of pure carbon dioxide into the canopies of trees in a 500 square meter plot every day for 6 months. This created an atmosphere with about 530 ppm of CO2, which is about 150% of what exists today.
Unfortunately, their experiment did not yield the results they had hoped for. The CO2 did not enhance the growth of the trees and leaves, rather the CO2 quickly passed through the bodies of the trees and quickly returned to the atmosphere. There was no decline in CO2 in the atmosphere and the extra CO2 did nothing to help with the photosynthesis of the trees or their oxygen emissions. Unfortunately, this demonstrates a need for more research to be done as to how to reduce CO2 in the atmosphere.
Article Link:
https://www.nature.com/news/2005/050822/full/news050822-7.html
Sustainability is a word that is used broadly and often, but it is a word that is difficult to boil down and conceptualize and can be defined and applied in many different ways. To me, sustainability refers to the development and cultivation of resources in a way that prolongs the life of our environment, ourselves, and the very resources that are being created. I think sustainability also refers to the concept of delayed gratification. Often, the easiest, cheapest and most immediately rewarding options are not good for the environment down the line. It can be tempting to operate in this way but the way to ensure positive outcomes down the line is by creating sustainable products that will have a lasting positive impact. While this costs more money and time, it is important to consider that sustainability is usually the better and more cost-effective option down the line to avoid expensive damage in the future due to poorly constructed products.
