Global Learning: Water Conservation

The key to making our world’s population more aware of the impact of the individual is to expose it. In general, we need to have higher standards and we need to do a better job to promote global learning from all three aspects: global awareness, global perspective, and global engagement.

In terms of resources, if a person was to cut his or her shower down from twelve minutes to four minutes, he or she would be saving sixteen gallons of water per shower, or 5,840 gallons per year. This could save a person up to $100 a year on water usage. It is these kinds of mathematics that provide people with the  incentive to change their unsustainable ways. But the big issue is getting this information out to the public, and actually making people relate the issue back to themselves.

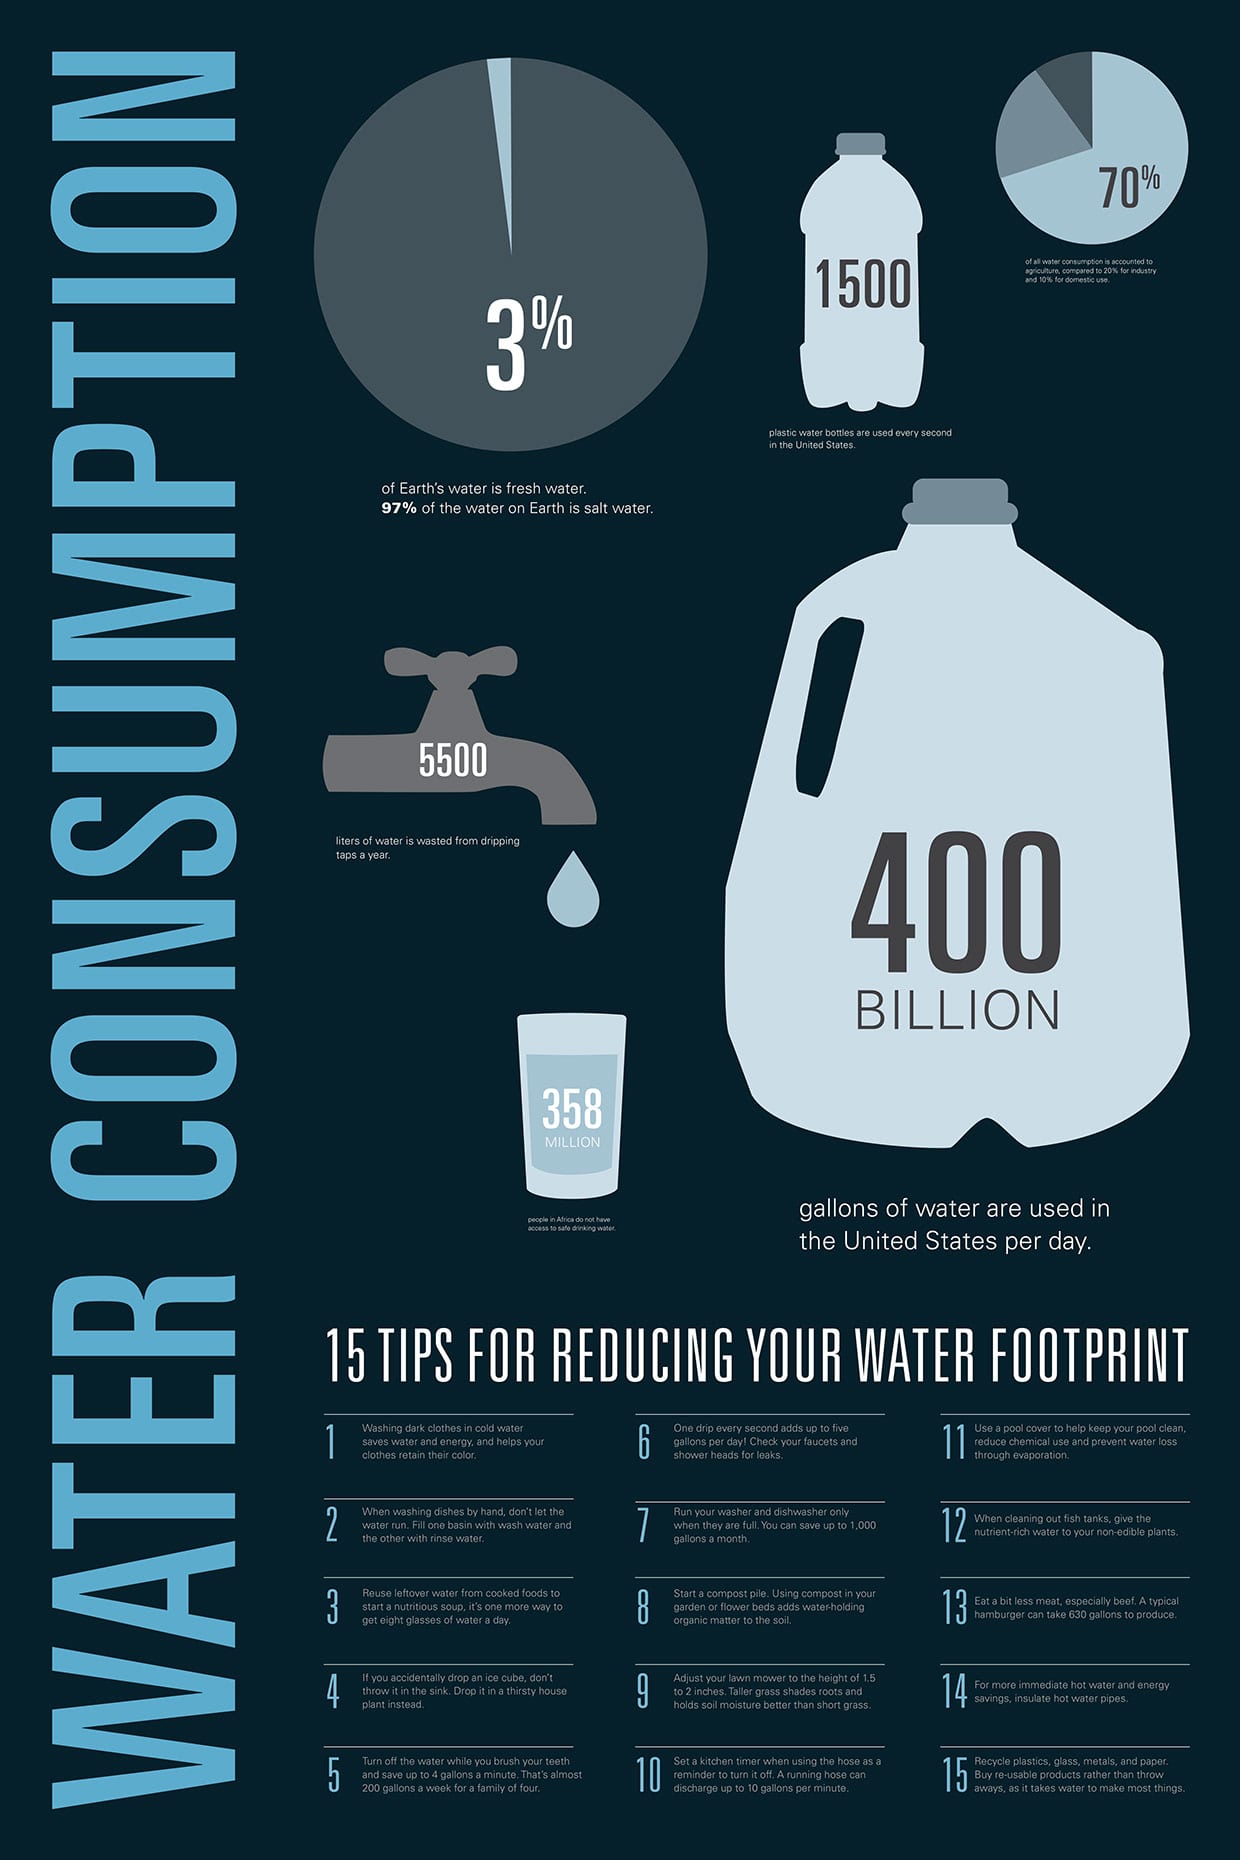
Water consumption is a huge concern for today’s population due to how wasteful we tend to be. More water consumed results in higher energy costs and possible shortages in areas where water is not easily accessible. Certain cultures, simply by geographic location, are naturally bound to have a smaller water supply and a higher demand from the population. A huge part of global learning is having that perspective that just because you have a faucet with running water, doesn’t mean another person across the globe has the same luxury.

Below is one way we can start to spread more information to the public.

Green Grant: Solar Tables

In order to make Union more sustainable, I propose that Union install solar tables behind Reamer Campus Center. These tables would have electrical outputs to charge phones or laptops and are perfect for the students that are sick of studying inside on a nice day. Creating these solar tables may also provide data to prove to Union how much money could be saved by installing solar panels on some of the buildings that receive constant sunlight.

Go with the Wind?

Wind energy refers to the process of creating electricity using the wind, or air flows that occur naturally in the earth’s atmosphere. Wind turbines are used to capture kinetic energy from the wind and generate electricity.

Wind energy projects have created many economic benefits to the U.S.. The projects have created jobs, created a new source of revenue for farmers and ranchers in the form of land lease payments, and increased local tax base. Wind energy can also lower electricity bills for those who neighbor the wind turbines.

In terms of employment, wind energy projects create new jobs in rural communities in manufacturing, transportation, and project construction. At the end of 2016, the U.S. wind energy industry accounted for 101,000 full-time jobs.

The US Department of Energy projects that we’ll have 404 gigawatts of wind energy capacity across the country by 2050, up from 89 gigawatts today. Because the overall electricity demand is projected to remain consistent, wind energy would soon help provide one-third of the country’s needs.

Currently, the major incentive to invest in wind is the renewable portfolio standard, which mandates a minimum amount of electricity to come from renewable resources. Another incentive is the federal production tax credit, which benefits wind energy installations across the entire country. Overall, wind energy is one of the fastest growing forms of electricity generation in the United States, with the largest share renewable electricity generating capacity in the country.


Population Growth and Decay in Schenectady, NY

According to the World Population Review, Schenectady, New York’s population as of 2017 is estimated to be 65,625 people. In comparison, Schenectady is the 9th largest city in New York, based off of the 2017 US Census Bureau. The review also revealed that the city had a population density of 6080.95 people/mi^2.

Based on information obtained from the American Community Survey, there was an average 2.67 people per household and the median income for households is $41,243. Lastly, 16.2% of families and 21.1% of individuals living in Schenectady are below the federal poverty line, where 38.3% of those under 18 are in poverty, and 10.2% of those 65 years or older.

So the question is how the population has fluctuated over the years. As you can see in the chart below, Schenectady suffered an enormous population decline with a decay rate of -11.01%  (roughly 10,000 people). In the years after, the population suffered a slow decrease that may have been caused by the economic decline the city suffered through. Below is a table and chart displaying the growth/decay of our city’s population. 

Will equal pay ever exist?

According to the Institute For Women’s Policy Research, women, on average, earn less than men in almost every occupation. In an article by Emmie Martin, of CNBC, I found the median income for American women both weekly and annually. The earnings were also divided between seven separate age groups: 16-19, 20-24, 25-34, 35-44, 45-54, 55-64, and 65+. For comparison purposes, the article also divulged the median income of American men at the same age. In my graph below, the men (blue) and women (pink) show the pay deficit between genders in America.

According to the same research, for every dollar earned by a man working full-time, year-round, a woman working full-time year-round earns $0.76. Another disturbing aspect of this debate is the fact that it does not take race into consideration. The IWPR tracks the gender wage gap and has found that if change continues at such a slow pace, it will take another 41 years (on top of the 55 that have already passed) for women to finally receive equal pay. The IWPR also reports that Hispanic women will have to wait until 2233 and Black


Sustainable Transportation

In his article, The World’s Top Cities for Sustainable Transport,  Niall McCarthy discusses the research behind the graph below, which identifies cities across the globe that have the most sustainable public transport in 2017. Hong Kong has been rank number one for sustainable transport. I wouldn’t have guessed that one of the most populated cities in the world would be able to maintain such a sustainable transportation system simply due to the mass amounts of people circulating around the city each day.

Surprisingly enough, two other asian cities are also in the top-10. Due to the 23 different indicators that were involved in the ranking, some cities scored well in urban mobility. The article also notes that the top U.S. city is actually New York City! Ranking 23 overall, New York scored really well for its subway system, train connections to Long Island and New Jersey, and wheel chair accessibility. Although it’s not on the graph below, New York scored very well in comparison to other major cities in the U.S..


Graph is based on data taken from 100 major cities across 23 different factors to rank the transportation services.

Changing the Course of Water Sustainability

Sustainability efforts continue to rise as awareness of the ecosystem’s demise becomes more of a global priority. Due to the increasing efforts, the need to identify the most effective plans of attack is also increasing. In terms of water sustainability, Will Sarni has identified three ways the course of water sustainability changed in 2017.

One of the most notable changes is the increasing efforts to more efficient tracking of water data. New public policies, like California’s “Open and Transparent Water Data Act,” require a statewide platform that combines various databases in order to provide the public with the most comprehensive water and ecological platform possible. The collaborative database highlights numerous issues, like water scarcity and climate change, that otherwise may go unnoticed. Other technological advances include more powerful sensors that track water quality, water usage, asset management, and water utility economics. The new technology can also provide a more accurate set of predictive analytics, keeping the public as updated as possible.

Although we are heading in a positive direction, certain large corporations continue to be huge contributors to the negative water usage. In an investigation by Christine MacDonald, Coca-Cola is identified as a huge source of false advertisement talking about its own sustainability efforts.

The company promised in an advertisement in The New York Times that “For every drop we use, we give one back.” Coca-Cola conducted a self assessment of their product which revealed that it took 35 Liters of water to make every half liter of Coke. The company promised in 2007 that its goal was to sustainably source 100% of key agricultural ingredients, but the follow through on this promise has been seriously lacking.

Coca-Cola isn’t the only offender of over using water. MacDonald reported that it takes 712 gallons of water to produce a single t-shirt and 462 gallons to produce a quarter-pound hamburger. People don’t realize how much water it takes even to produce the simplest of things. In the United States alone, the per capita Water Footprint is 2,060 gallons a day.


Irreversible Climate Change

In her article, “Irreversible climate change due to carbon dioxide emissions,” Susan Solomon and her colleagues express how the human race has such a large impact on the world’s climate change. The paper focuses on how the effects of increases in carbon dioxide on the atmosphere take around a thousand years to be repaired. Human activities were identified as the most prominent cause of the rise in “atmospheric concentrations of key greenhouse gases.” These increases in greenhouse gases, especially carbon dioxide, will result in a wider range of damaging and possibly irreversible climate changes.

Solomon highlights how complicated the multi-step process of carbon dioxide atmospheric extraction can be. The process includes “rapid exchange with the land biosphere and the surface layer of the ocean through air-sea exchange.” Typically, 20% of the added tonnes of carbon dioxide stay in the atmosphere while 80% becomes mixed in with the ocean. Ocean warming is just one quantifiable aspect of climate change. Unlike methane or nitrous oxide, carbon dioxide is the only greenhouse gas whose gases persist over time rather than periodic instances. The graphs below display the amount of carbon dioxide that is “expected to be retained in the atmosphere by the end of the millennium.”

These three graphs display carbon dioxide and global mean climate system changes. Results are represented with an 11-yr running mean.

Overall, the main point of Solomon’s article was to highlight how irreversible these small but detrimental gas emissions can be to our climate. Changes in sea levels, changes in precipitation, and changes in atmospheric warming can all be traced back to the increase in CO2 emissions into the atmosphere. Not only are these changes dangerous to the environment, but also play a vital role in the timeline of mankind.

Post # 1: Sustainability

Growing up living on a beach has exposed me to the detrimental effects that humans can have on the environment. Vacationers aren’t able to see the damage their carelessness can cause over time. Beach cleanups do assist with some of the pollution taking place on public beaches, but plastics still continue to get left buried in the sand. A study by Carolyn Barry found that these plastics can degrade somewhat rapidly, thus filling the ocean with chemical pollution. Just by chasing after that trash that blew away or picking up an empty water bottle while taking a stroll down the beach can make a huge impact. Every summer I partake in four huge community beach clean ups and the amount of trash collected each time is unsettling.

Through community service projects both on campus as well as at home, I aim to help reduce the community’s carbon footprint. I hope that through this class I can learn more about the other ways I can impact the environment. I also want to learn more about the global sustainability statistics and how carbon footprints can be measured.