Panther Population in Florida

Florida is a unique state to say the least.  It’s a place that’s brimming with various different plants and animals, and has many conservation areas of great beauty such as the everglades.  At the same time Florida is also in a constant state of development, as construction of shopping malls, housing, and retirement communities begin to fill up the state.  Coupled with this is the large number of tourists and vacationers that come to the state every year seeking sunshine.  All of this has impacted the wildlife and ecosystems of the region.  One animal that is currently endangered is the Florida panther.  Back in the 1970s and 80s when people were less environmentally conscious, the Florida panther population dropped down to around 20 or so.  It was estimated by the U.S. Fish and Wildlife service in 2017 that there were between 120-230 panthers.  The panther population has risen thanks to concerted efforts by conservationists to keep the panthers around, however, they are still severely endangered.

For clarity, let’s say that the population was 20 in 1975.  Let’s also say that the 2017 population was 180.  This is an obvious increase of 160 panthers over 42 years.  If we divide 160 by 42 we get the rate of change: 3.81 new panthers every year.    If in 1976 there were 23.81 panthers (up from 20 the previous year), then we can divide 23.81/20 for find the growth factor and percentage.  The growth factor is 1.1905 and the percentage increase in panthers per year is 19%.

It’s hard to believe that the panther population will soon skyrocket, but with careful study and effort, the population could likely go back up to a steady level.  This link highlights some of the dangers panthers face, and partially explains why there are so few of them.

Population Growth and Deforestation in Guatemala

The article that I chose to use looked at population growth and deforestation in Petén Guatemala. The population in 1960 was about 21,000 people and has risen to 600,000 today, which is over a 10% growth each year. This drastic rise in population forced the new citizens to find new land to survive. In Petén, the process of deforestation was designed to meet the new growing populations needs, but this process of removing trees will have a lasting effect on the growing population. This process of relocating people also made it extremely difficult to provide consumer goods, infrastructure, and health services. Without these necessities, families were being hurt due to the massive influx of new people.

Ultimately, the country will run out of room to house these people and will certainly create a rise in deaths. Countries should focus more on feeding their people while working within the natural environment rather than destroying the environment. Soon there will not be any naturally occurring forests and humans will be to blame, hopefully we never get to that point because it may be too late.

Population Growth and Decay Across the U.S.

According to USA Today, the fastest growing city in the United States is The Villages in Florida. In 2010 it had a population of 94,279 people and increased to 125,165 people in 2017. Between 2010 and 2017 the population increased by 30,886 people, or 32.8%, with a growth rate of 1.33. The fastest shrinking city in the country is Pine Bluff, Arkansas. In 2010 it had a population of 100,093 and decreased to 90,963 in 2017, which means the population decreased by 9,130 individuals. This also includes a percent decrease of 9.12% and a decay factor of .91.


In the fastest shrinking cities, such as Pine Bluff, the unemployment rate is greater than the national average. Also, it is possible that the reason some cities are growing faster than others is because of climate change. More specifically, over half of the fastest shrinking cities are in areas that experience harsh winters, while most of the fastest growing cities experience milder weather. This could make some areas more or less desirable to live in and could impact the population of various areas. 


Elephant Poaching Decreases African Species

Elephant poaching started at the end of the 20th century and has permanently damaged the overall population of African elephants across the continent’s 18 countries.  NPR’s article that was published in the late summer of 2016 recounts the shockingly high decline in elephant population between 2007 and 2014 which all account the illegal poaching for ivory. Many African’s get involved in the poaching industry because it is easy money and not terribly difficult to accomplish. Ivory is then sold to illegal traffickers which are then sold on the Chinese market. The entire industry is murderous and heartless because people ruthlessly kill elephants just for their ivory tusks.

The African elephant population declined 140,000 animals between 2007 and 2014 which took about $7 million dollars to conclude. The great Elephant Census, founded by Paul Allen, searched elephants for three years and which collaborated with Elephants without Borders and other government/non governmental organizations. They were able to record the elephant numbers by meticulously flying a small plane and writing down elephants they saw, making sure not to count those that had already been recorded. Only 352,271 elephants existed after the 7 year period, meaning that in 2007 (adding the 140,000) there were 496,271 elephants. When calculated, this is a 25% decrease in the elephant numbers and which continue to decrease today.


This graph from WWF shows a glimpse of the horrid poaching ramifications. If you’re more interested in this subject there is an awesome and captivating documentary on netflix directed by Leonardo Dicaprio called The Ivory Game on the entire ivory poaching market and the ways in which African organizations strive to capture those involved.


Human Population Growth Rate

World Population 1950-2100

During my research for this post, I found a graph on the world population and chose to implement the skills we’ve learned in class for this section. I decided to use the graph as my own new data to work off of. After gathering data from this graph, I found that in the 64 years between 1950 and 2014, the world’s population had increased by 4.76 billion people.

This computed out to be a 187.4% increase during the 64 year period (4.76 billion people [total change] / 2.54 billion people [initial] = 1.874). With this information, I went on to find the growth factor and rate of change.

2.54 billion people + 2.54 billion people x 1.874 = 2.54 billion people (1+1.874) = 2.54 billion people (2.287) = 7.3 billion people

After computing this solution, we can see that the growth factor was 2.287. To find the rate of change, I divided the total change (4.76 billion people) with the total amount of time (64 years), to find an increase of 74 million people per year.

Lastly, I have estimated that the growth of the world’s population between the years 1950 and 2014 was that of exponential growth, rather than linear. I found that the world’s population between 1950 and 2014 increased exponentially at around 1% per year.

 To find this, I made a table that looked something like this:

1950        1958        1966        1974

2.54         2.92         3.41            4        billion

_______________________

15%       16.78%      17.3%

380           490          590            million


Decline of Polar Bears

The Polar Bear population is declining and it is expected to continue declining in the future due to climate change. It is said that by 2050, the polar bear population could decline by 1/3. This is all due to the disappearing of arctic sea ice. The arctic sea ice is declining by a rate of 12% per decade since the 1970s. The melting of the ice and the warming of the waters is not a good climate for the polar bears because they are ice dependent. Much of the food they eat is primarily found in the arctic waters. Polar Bears rely on their access to seals as a sources of food and to breed.

Today, the population of polar bears is thought to be 26,000. By 2050, 8,580 Polar Bears will remain if this estimation remains true. That means that from 2018 to 2050 in this 32 year period the total change would be 17,420 polar bears. This means the decay factor is 0.33. Overall, something needs to be done to slow the decline of the polar bear population because right now they are at high rate of extinction. What is happening to polar bears is also happening to other species, so the issue of climate change needs to be addressed.


Growth of Uber

Uber is the top ride share app in the united states. Over the past few months Uber has been in the news for the effect they have been having on traffic in NYC. The saturation of drivers got to a point where the congestion and traffic was so heavy that Mayor Bill de Blasio put a cap on the growth of Uber drivers, potentially starting a trend in major cities (major markets) across the us. This graph is the exponential growth of drivers for Uber over there starting years.

It is important to notice that this growth is exponential and driven by customer demand. What will happen when the demand increases and Uber legally cannot support it. A lot is yet to be seen  and I am interested to see how their growth will continue.


Carbon Emission Intensity of Economies

Historically, economic growth has been linked to CO2 emissions.  Although countries who obtain differing levels of per capita CO2 emissions can still have similar gross domestic product per capita levels, these differences occur due to the differences in the CO2 intensities of these economies.  The article on Our World In Data explains that CO2 intensity measures the amount of CO2 emitted per unit of GDP. There are two key factors which affect the CO2 intensity of an economy; energy efficiency, and carbon efficiency.  Both factors simultaneously work together, because as efficiency improves in both energy and carbon usage, the CO2 emitted per unit of energy will fall.

The graph provided in the article shows CO2 intensity from 1990 to 2013 as a linear downward trend.  The CO2 intensity rates have been steadily falling since 1990. This can be considered a result of improved energy/technology efficiency, and increased capacity of renewables.

According to the graph, over the 23 year period between 1990 and 2013;

Total Change: -0.12kg

Decay Factor: (0.47kg/0.35kg)=0.74

Percentage change: (1-0.74)=.26= 26% decrease


Source: CO₂ and other Greenhouse Gas Emissions, Our World in Data 

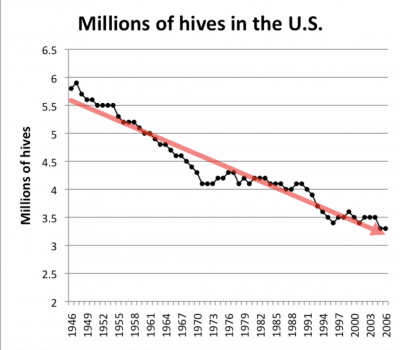
Decline of honeybees

Bees have been endangered for decades now, and the chart above depicts just how much the number of bee hives in the Unites States has declined since the mid 1900s. What is still in question is the roots of the bee population problem. Some scientists are questioning whether global climate change has anything to do with the endangerment. The article I read talked about how much the bees were affected by this problem. “Climate change can influence consumer populations both directly, by affecting survival and reproduction, and indirectly, by altering resources. However, little is known about the relative importance of direct and indirect effects, particularly for species important to ecosystem functioning, like pollinators.” Although some research shows that it does in fact have to do with climate change, the direct foundations are still uncertain. Based on this chart, I decided to calculate a the percentage change to get a more accurate percentage on just how much the population of bees has changed.

The percent change from 2000 to 2006 is about 6%.

Linear Global Population Growth

The article I looked at claims that despite popular opinion, the global population is not growing exponentially, but rather is growing in a straight line. Exponential growth is described as the growth rate of the population, as a fraction of the population’s size, and is constant. Therefore, if a population has a growth rate of 2%, and it remains 2% as the population gets bigger, it’s growing exponentially. Despite the starting points of two quantities, the one quantity that grows exponentially will become larger than one growing linearly. For the United States, the population growth over the past half century has been very close to a straight line, the R2 is 0.9956.

Essentially, it seems as if people confuse the words exponentially and increasingly when talking about population growth. The graph shown demonstrates linear growth, and how exponential growth occurs only when the percentage growth rate remains constant as the population gets bigger.