
The article I analyzed, entitled, Seven charts that explain the plastic pollution problem, by BBC News explains how plastic consumption, not only in the United States, but across the globe have a series of severe impacts on our environment, and maintain there for a plethora of years.
The article first explains the amount of plastic that have been produced to date of the article (December 2017). It has been recorded that 8.3bn tonnes of plastic had been produced, and as of 2015, only 9% was recycled, 12% was incinerated, and 79% was accumulated in landfills or in the natural environment. This vast amount of waste should not be extremely surprising, considering plastic products are usually ‘throwaway’ or ‘single use’ items.
Later in the article, it explains the amount of plastic that ends up in the sea. The article estimates that about 10m tonnes of plastic makes its way into the oceans annually. A study published by the National Center for Ecological Analysis and Synthesis and the University of Georgia in Athens conducted a survey which found that Asian nations were 13 of the 20 largest contributors to plastic waste in the oceans. Although the US was not the biggest contributor, we were still ranked in the top 20, meaning that we are not off the hook for ocean contamination.
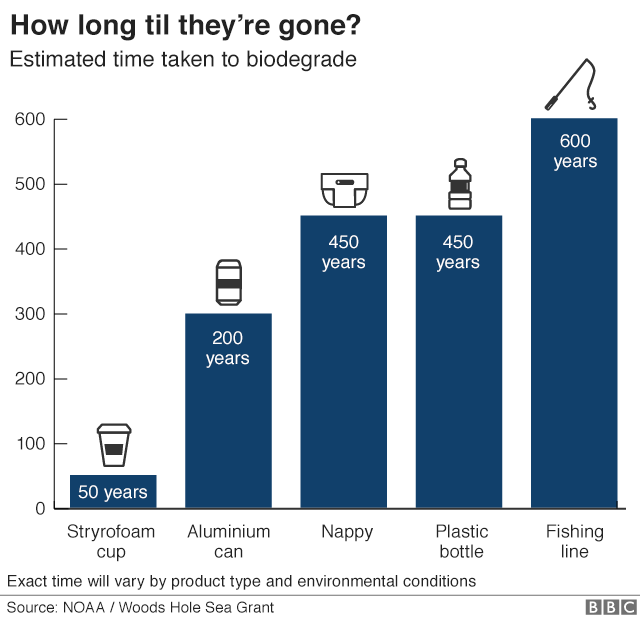
The most interesting graph I found was a bar graph that estimates how long certain plastic products take to biodegrade. The graph shows that it takes 50 years for a Styrofoam cup to degrade. This basically means that everyday your morning coffee cup will stay in the environment for about half a century.
Source: Seven charts that explain the plastic pollution problem
