
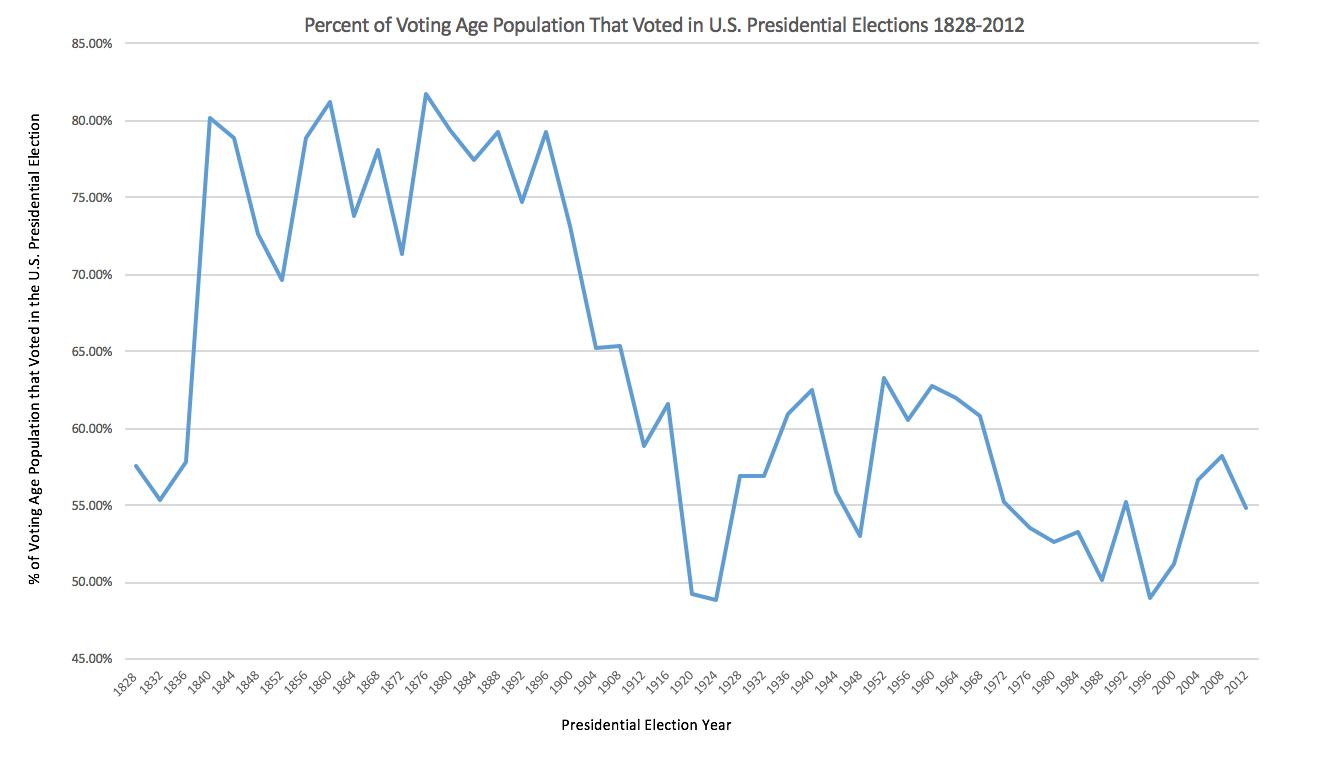
I see voter turnout as a social justice issue. Voter turnout has consistently stayed between 45 to 85% of the voting age population in the United States. Voter turnout has clearly correlated to social justice issues, including who is allowed vote, who can afford to leave work to vote, and who feels politically empowered enough to vote. We see large dips in voter turnout prior to the great depression, as well as in the early 2000s around the recession and around the recession in the 1980s. Whenever there are poor economic times, we see dips in voter turnout. We also see dips in voter turnout when the population has less confidence in the government– this is especially true for during and post Vietnam war era United States.
Another social justice issue related to voter turnout for presidential elections is the fact that those who are financially disadvantaged tend to not be allowed to leave work to vote within voting hours. This is an issue that has been combatted by other countries including Australia, which enacted mandatory voting legislation in 1918 and has imposed fines on those who do not vote. However, since voting is not mandatory in the United States, not all employers let their employees leave work to vote. Since the United States does not have mandatory voting laws, we can attribute many changes in voter turnout to social justice issues.
Link here to data.

Your graph did a great job at pointing out a pattern within our voting history. You brought up the idea that these fluctuations are often due to national politics and economics. By doing this, you gave a good background as to the pattern shown within your graph as well as elaborating in ways the graph could not. I like that you ended your argument with somewhat of a solution, such as the laws implemented in Australia imposing fines on those whom do not vote.
I think your graph makes the voting patterns clear throughout our history. I also think it is interesting that you propose a solution because having a fine for not voting is something that many other countries do and they do have higher turn out rates. Additionally, other countries have extended voting periods. I think that online voting or longer periods of voting could make it easier for everyone to cast a ballot on election day.
This graph really shows the voting history well, as just listing percentages would not have had the same impact. I am especially curious about the reason for the significant increase in the number of people who voted between 1836 and 1840 and the decrease in the number of voters between 1896 and 1900.
I think this data provides really important information that leads to concrete ways in which improvements can be made to increase voter turn out. It is a very good point that a large reason people don’t vote is that they cannot get off of work early. It would be interesting to get further data on the breakdown of the voter turnout amongst people of different occupations to compare.
History is really important as it tends to repeat itself, and you showing the past economic lows that increased voting turnout can be recreated when the trust in low in the government. The graph did a great job showing the pattern in the voting history and turn-out.