Sustainable Waste

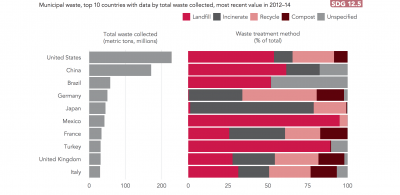
The Atlas of Sustainability publishes data from around the world about environmental sustainability. Above is a chart of the top 10 countries with the most municipal waste, how much waste is collected, and where that waste goes. The United States is responsible for the most total waste collected, totaling over 200 million metric tons of municipal waste. Out of the waste collected in the United States, over 50% (52.7%), more than 100 million metric tons, ends up in landfills in the year 2014. 12.8% of waste in the United States was incinerated. In the year 2014, only 25.7% of waste was recycled in the United States, and only 8.7% of waste was composted.

When waste ends up incinerated or in landfills, it can have negative environmental impacts. Landfill waste is responsible for greenhouse gas emissions of both carbon dioxide and methane. When waste is burned, these greenhouse gases are also emitted into the air. In addition to air pollution, landfills also account for groundwater pollution. When it rains, hazardous chemicals dissolve and collect at the bottom of landfills. These chemicals dissolve into the ground, polluting the ground and soil.

When we recycle, we save waste from ending up in these landfill facilities and are able combat environmental damage. In order to reduce our negative environmental impact, Americans should make an increased effort to dispose of their lifestyle waste through recycling or composting. This way of disposal is far more environmentally friendly, and not very difficult to practice.

U.S Consumption of Beef

Since posting last week about the water footprint of beef, I have not been able to get it off my mind. I took this week’s post as an opportunity to go a bit more in depth about the consumption of beef in the United States. An article I found discusses the shift of Americans from beef toward chicken consumption.

The graph shown below displays the peak of beef consumption in America during the 1970s, through the current decline of beef consumption per capita. During this 17 percent decline of beef consumption, greenhouse gas emissions decreased by 10%. As we can see, pork and poultry consumption have relatively stayed the same throughout this period of time. Though this means more chickens are being eaten, reducing the amount of beef consumed proves crucial to reducing our carbon and water footprint.

The article goes on to explain that the production of beef emits seven times the amount of greenhouse gases than chicken. Further, the carbon and water footprint of beef is roughly 20 times that of plant-based foods like beans.

The next graph shows that the production of chicken has increased by 5 times, while beef production has stayed consistent. This is partly due to the high demand for cheaper meats like ready to cook chicken. Beef takes longer to cook, making chicken an easier everyday option for most Americans.

Lastly, we should touch on America’s dietary footprint. Though we have decreased our consumption, beef still accounts for almost half of our dietary footprint. The final graph shows that American consumption of beef is not only one of the highest in the world, but actually four times the world average.

These trends all point to one thing: reducing our production and intake of beef will substantially decrease our carbon footprint within a single generation.

Sustainable Transportation

In his article, The World’s Top Cities for Sustainable Transport,  Niall McCarthy discusses the research behind the graph below, which identifies cities across the globe that have the most sustainable public transport in 2017. Hong Kong has been rank number one for sustainable transport. I wouldn’t have guessed that one of the most populated cities in the world would be able to maintain such a sustainable transportation system simply due to the mass amounts of people circulating around the city each day.

Surprisingly enough, two other asian cities are also in the top-10. Due to the 23 different indicators that were involved in the ranking, some cities scored well in urban mobility. The article also notes that the top U.S. city is actually New York City! Ranking 23 overall, New York scored really well for its subway system, train connections to Long Island and New Jersey, and wheel chair accessibility. Although it’s not on the graph below, New York scored very well in comparison to other major cities in the U.S..


Graph is based on data taken from 100 major cities across 23 different factors to rank the transportation services.

Unilever’s Sustainability Report

The huge corporation, Unilever, whose company mission statement states, “We meet everyday needs for nutrition, hygiene and personal car with brands that help people feel good, look good and get more out of life” started a sustainability campaign in 2010 due to increased distaste from the public with regard to Unilever products.  Every year the company conducts a “Sustainable Living Plan” progress report and in the first year of the campaign the company’s greenhouse gas intensity fell 16% from 118.31 to 99.97 kg per metric ton of production, as seen in the pie chart.  According to this chart which was included in the progress report the highest amount of greenhouse gas emission comes from customer use of soaps, shampoos and shower gels.  As of 2018 the company has set a target to double its business while halving the environmental footprint of its products across the value chain, and sourcing 100% of agricultural raw materials sustainably, all by 2020.  This goal was set in 2010 so the 2020 goal seemed lightyears away but with 2020 right around the corner, data analysts have criticized Unilever for not providing the whole picture with regard to their sustainability progress.  Specifically in the 2011-2012 progress report there was no data to back up this chart, there was only the chart.  On the Unilever website, the company claims that that it is on-plan for every individual sustainable sourcing target thus far.  I suppose we’ll find out in two years.