Climate Migration

My Political Science thesis is  looking at climate migration, which is the movement of people as a result of the negative impacts of climate change such as natural disasters, and sea level rise. I am specifically looking at Small Island Developing States (SIDS) such as the Marshall Islands and Solomon Islands in the South East Pacific Ocean that will be displaced in the short time span of 25-30 years, if not sooner, if the globe community continues to emit the present, abusive rate of Green House Gases (GHGs) into the atmosphere.

This research looks at not only the effects of climate migration, but I’m hoping to use the diction of environmental racism to gain these migrants refugee status under the UN definition until further policy can synthesized and implemented. I intend to work on shaping some of this policy in this thesis in tandem with the current migration world policies in regards to internal and external movement.

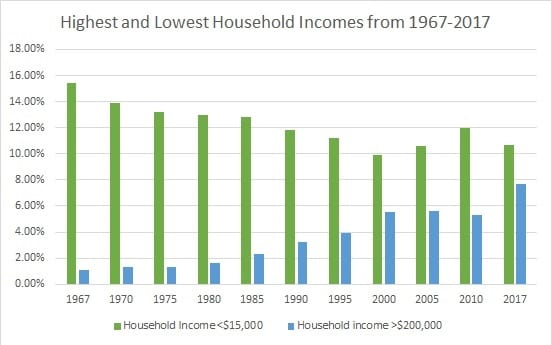
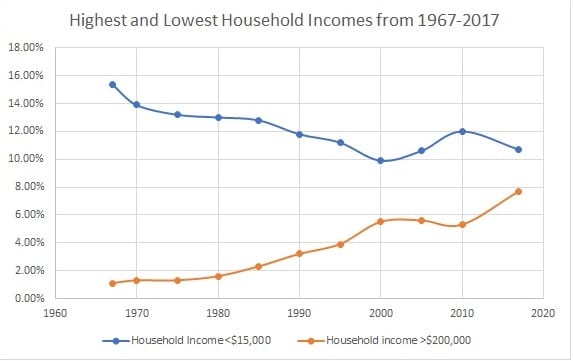
I found an article from National Geographic’s talking about the topic generally, but discussing the number of people that will actually be displaced by 2050. Here are those numbers on a simple bar graph to show the optimistic projectiles vs. the more realistic number of people displaced if we continue leaving the same carbon footprint we are presently engaged in within the Anthropocene.

Here’s a link to the graph (just because I’m still having issues with my computer):

https://docs.google.com/spreadsheets/d/1K8kDLpyiTHFhd8pllKvd3OCndVgPAUxPg8SxvLJcjb0/edit?usp=sharing

Poverty in America

After looking over the options that Professor Wang gave us for this blog, I was drawn to the topic of poverty. Many people will go to lengths to talk about poverty around the world, specifically Africa when it’s imperative that we look at our own country’s homeless and struggling Americans. Poverty USA is a website that informs its readers about the percentage of people in the United States who live in poverty. According to this website, in 2016 27.6% of Native Americans lived in poverty. Other ethnicity percentages of those who lived in poverty are as followed: 26.2% Black, 23.4% Hispanic, 12.4% White, 12.3% Asian. In order to make my chart, I rounded the number to the nearest digit so that it was easy to imagine how many people were homeless out of 100 people. We speak a lot in class about ways in which we can interpret numbers, and it is difficult to imagine a percentage of Americas population when there are millions of people who reside in the country. Below is my pie chart.


Employment Rates in 2000-2005

I looked at data concerning the employment rates of single mothers vs. married mothers in 2000-2005. Unsurprisingly, the data showed that single mothers were challenged in the job market. In 2001-2003, both single and married parents employment rates dropped due to the recession. Afterwards, married parents employment rate increased but the single mothers did not. This is an issue we as a society must deal with because single mothers often do not have the same resources as married parents.


Graduation Rates in NYC in 2002 & 2003

The article that I looked at on Radical Math, showed graduation rates in 2002 and 2003 between male and female students while taking into consideration their race and ethnicity. The groups I looked at were American Indian/Alaskan Native, Asian/Pacific Islander, Hispanic, Black (not Hispanic), and White (not Hispanic). Female students in nearly every category had higher graduation rates when compared to the Male students.

I found this graph and data very interesting and helpful to see how well we as a society have come. Considering the data is from 2002, it is great to see numbers for both males and females continuing to increase in NYC and throughout the rest of the country.

Global Healthcare Facilities

It is no secret that some countries offer better healthcare than others. Some have socialized medicine, some have public and private medicine and some have Universal care. Because healthcare is such an important resource, many countries have poured a great amount of funding, engineering and research behind their healthcare system. Those countries that prioritize healthcare, often do have the best health systems. Other times, it is more affluent nations that have the ability to provide advanced care for its citizens. Either way, it is clear that there are countries with superior care options than others. But how do we measure this? Are all countries being judged fairly?

A study conducted by Siemens in January of 2015 thought that by measuring the quality and accessibility of healthcare facilities in different countries, we could better define what ‘good’ healthcare actually means. In one graph, they measured the number of hospital beds per 1000 people. This aimed to see which countries have invested in helping and providing access to the greatest number of people.

Image result for global access to healthcare statistics

And then they showed a chart of the countries with the most access to improved sanitation. By this, they intend to show the correlation between countries that have the resources to create improved sanitation technology, and those that have the wherewithal to provide superior medical access and facilities to its people.

In the Southeast Asian and African Region the proportion of population with access to improved sanitation is far below the global average

These two figures show that we cannot view healthcare in a vacuum. It is obvious that the wealthier countries have the better healthcare systems- at face value. But we cannot judge a developing country against an economic superpower country because their resources are not equal. This is why, many developing countries do not get the aid that they need to advance because they are discriminated against. They are viewed as less than, and thus makes it harder for them to improve. It is sad that, as a global community, we are so focused on ‘being the best’ instead of helping those in need. It is important to remember for people that live in countries with superior healthcare to remember that there is more we can do to help developing countries give their people the care that they need.

Social Justice and Voting for U.S. Presidential Elections

I see voter turnout as a social justice issue. Voter turnout has consistently stayed between 45 to 85% of the voting age population in the United States. Voter turnout has clearly correlated to social justice issues, including who is allowed vote, who can afford to leave work to vote, and who feels politically empowered enough to vote. We see large dips in voter turnout prior to the great depression, as well as in the early 2000s around the recession and around the recession in the 1980s. Whenever there are poor economic times, we see dips in voter turnout. We also see dips in voter turnout when the population has less confidence in the government– this is especially true for during and post Vietnam war era United States.

Another social justice issue related to voter turnout for presidential elections is the fact that those who are financially disadvantaged tend to not be allowed to leave work to vote within voting hours. This is an issue that has been combatted by other countries including Australia, which enacted mandatory voting legislation in 1918 and has imposed fines on those who do not vote. However, since voting is not mandatory in the United States, not all employers let their employees leave work to vote. Since the United States does not have mandatory voting laws, we can attribute many changes in voter turnout to social justice issues.


Link here to data.

$15 Minimum Wage? Think Again.

There has been, for years now, clamoring in political and economic circles to raise the government-mandated minimum wage to $15/hour.

Now, this sounds fantastic on paper. After all, who wouldn’t want to make $15 an hour?

Yet, there’s a simple problem with the $15 minimum wage: raising the minimum wage only raises the cost of living.

Think about it in basic terms. I’ve used my family’s pizzeria business before as an example, and I’ll do so again here.

Currently, I make $10.40/hour. That is, after all, the current New York State Minimum Wage. My family’s pizza business employs, let’s say, 10 workers. All 10 of these workers make minimum wage. Let’s say each person works 25 hours a week. That is to say that, per week, the business pays $2,600/week in wages.

($10.40/hour) x (25 hours/week)= $260/worker ———- ($260) x (10 workers) = $2600/week

Now let’s say, all of a sudden, the minimum wage jumps to $12.50/hour, as it is scheduled to do by the end of 2020. Now, the business must pay $3,125/week in wages.

($12.50/hour) x (25 hours/week) = $312.50/worker ———- (312.50) x (10 workers) = $3125/week

Now, this is fantastic for the individual worker. Working the same number of hours, and doing the same work, they see their weekly income rise by over $50.

Yet, for the small business owner, this is unfortunate. The small business owner now must come up with an additional $500+ to pay their employees. That money doesn’t simply fall out of the sky, or off of a tree. How do they reckon with this? They take the only reasonable avenue available to them. The business owner passes the cost onto the consumer. They raise their prices.

Now, our employee has to pay $8.00 for a cheese pizza when it used to cost $6.00. They have to pay $12.00 to see a movie at a local theatre, when it used to cost $9.00.

Soon enough, the $50 raise they got as a result of a rising minimum wage is gone. It evaporates into thin air.

I attached some pretty rudimentary graphs below to try to help illustrate.

Will equal pay ever exist?

According to the Institute For Women’s Policy Research, women, on average, earn less than men in almost every occupation. In an article by Emmie Martin, of CNBC, I found the median income for American women both weekly and annually. The earnings were also divided between seven separate age groups: 16-19, 20-24, 25-34, 35-44, 45-54, 55-64, and 65+. For comparison purposes, the article also divulged the median income of American men at the same age. In my graph below, the men (blue) and women (pink) show the pay deficit between genders in America.

According to the same research, for every dollar earned by a man working full-time, year-round, a woman working full-time year-round earns $0.76. Another disturbing aspect of this debate is the fact that it does not take race into consideration. The IWPR tracks the gender wage gap and has found that if change continues at such a slow pace, it will take another 41 years (on top of the 55 that have already passed) for women to finally receive equal pay. The IWPR also reports that Hispanic women will have to wait until 2233 and Black


Change in Household Incomes since 1967

For this post, I decided to look at various household income levels in the U.S. and how they’ve changed over time.  Specifically, I wanted to see what percentage of the population belongs to the highest bracket of income (>$200,000) and the lowest bracket (<$15,000).  My source for this was the U.S. census bureau, which had helpful downloadable charts on poverty and income levels.  The chart I looked at broke down income levels by race as well.

The change in income levels from 1967 to now is interesting and requires a bit of unpacking.  These two graphs I made help visualize this change.  One is a bar graph and the other is a line graph.

Both graphs show that in the last 50 years or so there became more households in the $200,000 threshold, and less households in the $15,000 threshold.  This might point to the idea that there is considerably more wealth now than there was in the 1960’s.  While this might be true, there are several other factor that can be taken into account.  The largest of these is inflation.  The value of a dollar has gone down since the 1960’s.  According to dollartimes.com, $300 in 1967 would be worth $2,250 today.  This explains why there were so few households with >$200,000 in the 1960’s, as that money then would have been worth around $1,500,000 today.  Coupled with this is the idea that someone could successfully live off a $15,000 a year salary in the 1960’s, but that certainly isn’t possible now.  It’s unfortunate that some people have to live in this threshold.  Doing things such as raising the minimum wage might help, but its hard to determine what the exact effects of doing this would be.  It would probably improve the lives of some workers, but it might also contribute to inflation, and a push by companies to use automated workers instead.  One other brief observation about the graph is the brief dip around 2008-2010.  This likely has to do with the stock market crash of 2008.

Gentrification of Schools in Washington D.C.

This is an interesting topic to write about for the blog this week. When looking through the sub topics that Professor Wang provided my eyes immediately went to the gentrification section. Over this past year I was fortunate enough to spend a term in Washington D.C. and take one of three courses on the places and spaces of D.C. This included a major topic on the gentrification that has been taking place there for the past 50 or so years. It has been extremely influential to the population of people there and is a fascinating and debilitating. It does not only effect the ability for people to live there but also to raise their children in the proper and nurturing environment. Within the gentrification that occurs in DC one of the telling graphs that can be expressed is showing the inequality of education. Since gentrification is tied with income and the cost of living and rent, it can be brutality shown who can afford to send their children to a private school which are located in the gentrified areas and who is sending their children to the cheaper option of public school. This is not to say that there is anything wrong between the two types of schooling it is being used to simply look at the difference in wealth between the races of DC. Through the cost of education one is able to identify where more money is located and being spent as well as how the coast of educational institutions has changed over a multiple year period.


For my graphs I was able to find data on the races of public and private schools as well as the comparison in numbers of public versus private schools over multiple years.


Following the 2007 graphs are the comparison to 2014 after major gentrification had taken place.


One thing that I think is the most noticeable is the large increase in private charter schools over just a seven year period. Further it is then not surprising to see the jump in numbers of students enrolled in the charter versus TPS schools.