Decline of honeybees

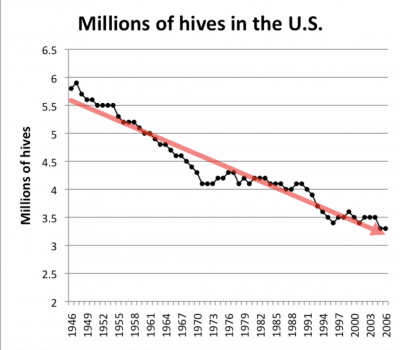
Bees have been endangered for decades now, and the chart above depicts just how much the number of bee hives in the Unites States has declined since the mid 1900s. What is still in question is the roots of the bee population problem. Some scientists are questioning whether global climate change has anything to do with the endangerment. The article I read talked about how much the bees were affected by this problem. “Climate change can influence consumer populations both directly, by affecting survival and reproduction, and indirectly, by altering resources. However, little is known about the relative importance of direct and indirect effects, particularly for species important to ecosystem functioning, like pollinators.” Although some research shows that it does in fact have to do with climate change, the direct foundations are still uncertain. Based on this chart, I decided to calculate a the percentage change to get a more accurate percentage on just how much the population of bees has changed.

The percent change from 2000 to 2006 is about 6%.

Linear Global Population Growth

The article I looked at claims that despite popular opinion, the global population is not growing exponentially, but rather is growing in a straight line. Exponential growth is described as the growth rate of the population, as a fraction of the population’s size, and is constant. Therefore, if a population has a growth rate of 2%, and it remains 2% as the population gets bigger, it’s growing exponentially. Despite the starting points of two quantities, the one quantity that grows exponentially will become larger than one growing linearly. For the United States, the population growth over the past half century has been very close to a straight line, the R2 is 0.9956.

Essentially, it seems as if people confuse the words exponentially and increasingly when talking about population growth. The graph shown demonstrates linear growth, and how exponential growth occurs only when the percentage growth rate remains constant as the population gets bigger.

Fertility Rates Throughout the One Child Policy

Is it weird to think that a country could introduce a policy that limits the amount of children a family is allowed to have? I think it is a bit odd, but I do understand the reasoning behind it. Throughout the middle of the 20th century, China’s population rapidly increased. From 1960-1975 the each woman on average gave birth to 5 children. But then, in 1979 the One Child Policy was introduced to help control the population.

This strategy worked in population control, but not with gender demographics. Because, many families still work on farms, they decide to keep the male babies and put their female babies up for adoption. This resulted in a ratio of for every 120 men, there are 100 women. This ratio then suggests that by the year 2030, there will be over quintuple the amount of males who have never married. Since this policy has been implemented and then edited, now each woman on average has 1 to 2 children.

Lets break this down,

In 1960, the fertility rate was 5.75 children per woman

In 2018,: 1.64 children per woman

Decay rate: 1.65 children / 5.75 children = .285

Percent change 1-.285 = .715 = 71.5%

–>  this suggests that there is a 71.5% decay rate of fertility per woman throughout the time in which the One Child Policy was applied.

I find it interesting that the government is controlling how many children each family is a allowed to have. As a child of the One Child Policy, I support the idea of why it the policy was applied, but it does not surprise me that there are more males and females and now the countries is concern is reproduction.