Solar Photovoltaic Energy

When people think of solar power, they often think of solar panels on the roof of a house, also known as photovoltaic devices. When sunlight hits these panels, the electrons move freely through their cell, which generates electricity. Solar photovoltaic energy is pollution and noise free, making it a strong alternative to other, less sustainable energy sources. While some people choose not to install solar panels on their homes because it is expensive, solar panel prices are currently on the decline. According to this article, the average price of a solar panel system has decreased by 59% in the last 10 years. The installation price has also decreased because there are more experienced installers available. On a global scale, the U.S. is the fourth largest market for solar panels, behind other countries that have stricter policies to switch to more sustainable practices.

Google now has a feature that enables you to enter in your zip code and it will tell you how much money you could save on your electric bill by installing rooftop solar panels. In Schenectady, it is estimated that you could save $8,000 over a 20 year period. This calculator also takes into account the amount of sunlight each address gets. When I looked up my house in New Jersey, it said my family would lose $37/month if we were to install solar panels because the house is completely in the shade.

The downside of solar photovoltaic energy is that it is weather dependent. If it is very cloudy outside, there may not be enough sunlight to power the system. Also, if the panels are used to power a lot of buildings, opposed to a single home, it may require a lot of empty land to house the whole system.


The Basics of Wind Energy

An example of a renewable energy source that I examined was wind energy, which creates electricity by using the wind, and air flows that occur naturally in Earth’s atmosphere. With the creation of wind turbines, we were able to capture kinetic energy that was created by the wind and generate electricity.  There are three distinct types of wind energy: Utility-scale wind are wind turbines that range in size from one hundred kilowatts to megawatts. The electricity is delivered to the power grid and then distributed to the end user by electric utilities or power system operators. Distributed or “small” wind single small wind turbines that are below 100 kilowatts and are used to directly power a home, farm or small business and are not connected to the grid. And the third type is generated by Offshore Wind, these turbines that are erected in large bodies of water, usually on the continental shelf. Offshore wind turbines are larger than land-based turbines and can generate more power.

The turbines typically stand a little over 260 feet high and wind measurements are collected, and they direct the turbine to rotate while facing the strongest wind, at the correct angle of its blades to capture energy. Over the course of a year, turbines can generate enough usable electricity over 90 percent of the time. These turbines begin to generate power when the wind reaches six to nine miles per hour and will shut down if the wind reaches over fifty-five miles per hour to avoid damages. The building and maintaining of these wind turbines can provide new jobs and begin the spread of “wind farms”.

Food Scraps as Fuel

In 1879 Sir Charles Chamberland invented the autoclave which was later used to develop a waste autoclave which was later used to develop today’s organic waste converter.  Here’s how an organic waste generator works: 1) Organic waste (food scraps, mulch, firewood, biosolids, etc.) is superheated then 2) moisture is released from the heating of these materials which acts like steam and the 3) steam is used for power generation.

Organic waste converter technology is a sustainable alternative to traditional methods of waste disposal such as incineration and landfill dumping which have destructive effects on our environment.  Not only do organic waste converters reduce our carbon footprint and avoid polluting emissions, but they also result in a usable end product known as biofuel, soil compost, or building material (if mixture contains wood/garden scraps).  Organic waste converters vary in size; they are used in households to fuel a car or they are used in large corporations such as hospitals, which generate huge amounts of food scraps and biosolids, who then use the steam to generate electricity for the facility.  There is a large push in the U.S. to construct on-site organic waste converters in supermarkets.  Supermarkets throughout Europe have already implemented this technology and results have shown that there are massive decreases in electricity costs, waste disposal costs and carbon dioxide emissions.  Green technology is the ability of modern converters to transfer mechanical energy and friction force on the waste mass into heat energy that is used in the pasteurization and sterilization processes.  In the future we should look forward to seeing more green technology integrated into our daily life.

Geothermal Energy Advancement State to State

This past month, the United States Department of Energy announced seven projects to advance geothermal energy development across the country. One of the projects will occur right next to us at Union; in Niskayuna, NY.  The projects will total approximately $11.4 million and will focus on geothermal energy enhancement through the implementation and research on the benefits and consequences of this renewable energy source.

Geothermal energy is a geographically bound.  It cannot be easily implemented in all areas of the country, and is currently solely located in the western states of the U.S.  Geothermal energy is basically using heat from the Earth as energy. It uses the warmth of the Earth as steam to heat buildings and homes.  The positive aspects of this type of renewable energy source is that it does not produce CO2 emissions, it is sustainable and can work throughout the day or night, and it can be very price competitive if situated in the right area.  Cons to geothermal energy include the deterioration of geysers and springs, and also the presence of toxic elements such as arsenic and mercury, which can contribute to health problems.

Currently, American geothermal electricity contributes 3.8 gigawatts of electricity on the grid.  The projects implemented will help expand the current systems, and is estimated to contribute 100 GW of currently inaccessible resources.  It is also supposed to remove geographical barriers of conventional geothermal resources. The projects will take place in a variety of locations across the country including, Argonne, IL; Stillwater, OK; Albuquerque, NM; Norman, OK; and at the Texas A&M Engineering Experiment Station.

This is important because one project is occurring in our backyard, at General Electric Company in NiskayunaThis project is research based. It will work on developing and testing new directional drilling orientation sensors that are capable of operating at 300°C for a prolonged period of time (1000 hours). This research will allow measurement while drilling (MWD) at substantially hotter temperatures needed for geothermal drilling than current tools.

Through these projects, the US will hopefully limit the amount of CO2 produced in the atmosphere and create an energy source with an essentially limitless supply of energy for billions of years to come.

Sources:

Energy Department Announces $11.4 Million for New Projects to Advance Efficient Drilling for Geothermal Energy 

Renewable Energy Sources: Geothermal Energy


Arctic

The arctic has been a section of the world with the clearest negative impact of the effects of climate change. The ice caps are slowly melting, while there are different species of life being threatened through the diminishing food source in this densely populated area. The melting of the ice effects the environment in so many negative ways like releasing trapped bacteria in the ice, eliminating food source that can’t adapt, and creating an unstable life cycle. There are different species of assemblages that have adapted to the living conditions of both above and under the ice, representing 20% of the main algae source of food in the Arctic. The melting caps are causing these limited resource available to the birds, fish, and marine mammals causing many of these animals population to diminish because of the lack of algae. The polar bear is one of the most effected as they really on the smaller food source around that really on algae. The interruption to the life cycle in the Arctic was caused by humans and these animals are suffering without having any major cause in the event. The table shows the decline sea ice in the Arctic Ocean measured annually starting from the 80s to the 10. This correlates to the global warming of the planet, causing global change and the arctic is being impacted in rapid rate. 

Internal Displacement and Apathy

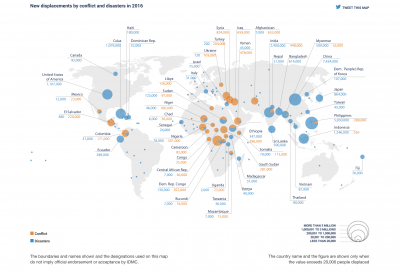
The issue of internal and external migration of people is something I am very passionate about, and I think it is fascinating the amount of factors that provoke the migration of people whether the factors be environmental, violence, race, lack of resources, economics, etc. According to the 2017 Global Report on Internal Displacement, the global rate of internal displacement in 2016 was equivalent to one person forced to flee every second totaling to 31.1 million new internal displacements catalyzed by conflict, violence, and disasters in one years time.

In 2015 according the UNHCR there was a total of 40.8 million internally displaced peoples which means if we add the new figure of 2016 to that of the 2015 figure on internally displaced people the growth rate would be approximately 1.76 of internally displaced people globally and a rate of change from 2015 to 2016 of 31.1 million people displaced/year. Even though these figures are staggering, according to the IDMC, “Each year, IDMC provides robust, compelling evidence on internal displacement. Each year, the evidence fails to elicit a response commensurate with the scale of the problem. Why? Because of international indifference, lack of accountability, and state failure to protect.”

Giant Panda Population Increasing After Being Called Extinct

Through my research of trying to find an article regarding the topic of growth and decay, I decided to focus in on the the topic of the giant panda population, and how they have been deemed a “vulnerable”, rather than an “extinct”, species. I read about it in this article.

The giant panda population has been known as the “world’s most beloved conservation icon”. Acting as the symbol of WWF, the World Wildlife Fund, the giant panda’s population increase is a relief to so many, as it is showing that conservation efforts are paying off in the end.

In the article, it is stated that there was a 17% rise in the giant panda population leading up to 2014. This was when the census recorded 1,864 giant pandas in the wild in China.

What this increase in the panda population shows us is that when people come together for a common cause, they are able to make a major difference in the environment. People and communities have been battling this extinction for quite some time, and the efforts are proving successful.

Wildlife Populations

In the World Wildlife Fund’s 2016 Living Planet Report, the organization reported that there was 58% decrease (.42 decay factor) in the populations of vertebrate animals from 1970 to 2012, such as mammals and birds. The terrestrial population decreased by 38%, a .62 decay factor. Even more alarmingly, WWF found that the populations of freshwater animal species decreased by 81% (.19 decay factor) from 1970 to 2012. These numbers are equally shocking and terrifying to me. Only 19% of the 1970 freshwater animal population still remained in 2012.

What is the reason for these extreme drops in animal populations? The World Wildlife Fund gives us 4 main reasons why this has occurred. First, habitat loss and degradation as a result of commercial and residential development. Second, our food systems have a negative impact on the natural world, such as overfishing. Third, climate change requires animals to adapt to different environments, damaging reproductive cycles and migration timing. Finally, species overexploitation harms animal populations. Sometimes this is direct and intentional, such as with illegal hunting, and other times it is unintentional, such as catching one type of fish when you meant to catch another type.

People should stay away from wildlife crime, it is both wrong and unsustainable. In addition, everyday changes we can make to our lifestyle to prevent climate change can help stop this massive decrease in animal populations.

Quantifying Increase in Drug Offenses in Federal Prison Population

In my last post, I created figures depicting the overall trends in the general federal prison population as well as these trends broken down to account for different types of offenses. I was especially intrigued by the information on the prevalence of drug offenses leading to incarceration from 1990 to 2014. From looking at the graph, it is clear that the drug offenses have accounted for the greatest proportion of crimes leading to incarceration on the federal level. The green line used for this offense on the graph stands out and reaches much higher than the other ones. It is also clear from looking at this figure that the most significant increase in drug offenses was at the beginning of the figure, from 1990 to 2000 and it seems to level off somewhat from 2000 to 2014. Due to this interesting trend, I did calculations to specifically quantify the increase in drug offenses during this time.

I first focused on the time period of 1990 (31,300 inmates) to 2000 (74,276 inmates). During this time, there was an overall increase of 42,976 federally incarcerated drug offenders, therefore the number increased by an average increase of about 4,297 inmates per year over these 10 years. This means that the number of drug offenders increased by 137% from 1990 to 2000 and increased by about 13.7% each year during this time period. This is a huge increase from both the 10-year unit perspective and when it’s broken down into yearly increases. An increase of 137% overall means that the number of drug offenders in 2000 increased by double plus one-third of the population in 1990.

I also examined the period of time where these numbers seemed to level off. Often, when you see a graph level off after a large increase or decrease, it appears stable and resolved at first glance. But, a seemingly stable line could still indicate a significant change. Between the years 2000 and 2014, the number of drug offenses increased by a total of 21,524 people and over these 14 years there was an increase of 1,537 offenders each year. This indicates an increase of 2.1% per year over these 14 years. This seems like a minor change that may not be important, but when you look at the total increase, the impact appears much greater. This 2.1% yearly increase led to a 29% overall increase in drug offense incarcerations from 2000 to 2014. Although this increase is not as dramatic as the increase between 1990 and 2000, this still accounts for almost additional one-third inmates incarcerated for drug offenses which is pretty significant.

When the time is taken to further analyze graphs such as this one, it increases the understanding of the magnitude. While an almost straight line might suggest stability at first glance, further investigating the relationship results in a more thorough understanding.

Tiger Populations in India, After a Long Decline, Are Finally Coming Back

Everyone, at some point in time, has named the tiger as their favorite animal, and apart from being stunning and fascinating creature they are far more important then just as a beautiful animal. An obvious benefit to the existence of the tiger is the fact that, as a major predator, they maintain balanced ecosystems within their own habitats. Another less apparent benefit is economically, since tigers are mainly found in large numbers in areas with high poverty rates, such as India or Nepal, the presence of larger numbers of tigers will eventually lead to a tourist trade. This new tourist trade can benefit small businesses in rural communities and provide a greater flow of currency through these areas.

India conducts a census of tiger population every four years, and there latest census for 2018 is set to be released in January of 2019 with tiger numbers estimated to cross over the 3,000 mark. As of 2014 the tiger population was set at 2,226 tigers left in the wild, up 520 from the 2010 number of 1706, which marks the first time that tiger populations have been steadily increasing in one hundred years. The growth factor, just using those most recent values, comes out to around 1.30 with a percentage change of 30.5%, and a rate of change of about 130 tiger increase per year. Strictly looking at these values of exponential growth the 2018 census numbers may fall short of the 3,000 estimation around 2,894 wild tigers. The most recent worldwide numbers for tiger population stand around 3,890.