
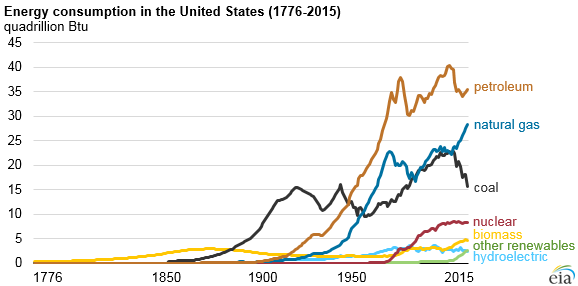
One component of sustainability, focuses on the effect that occurs on the environment when harnessing fuel and energy. As the United States hit the Post Civil War Reconstruction Era, the use of coal supplanted a vast portion of the total energy usage done by the United States. Moving along the 20th century, the use of natural gas and petroleum has shot up exponentially. Curiously, following the invention of nuclear weapons and the creation of nuclear reactors, the energy usage as a percent of the total United States energy usage does not exceed 10%. This number surprised me, but I think it alludes to the extreme dependency and emphasis that the United States (as well as the rest of the world) places on petroleum and natural gas. As a result of our dependence, marginalizing and scaling down petroleum and natural gas extraction methods for the sake of environmental cleanliness will be met with steadfast opposition. Therefore, the dichotomy between the profits and ingrained role that natural gasses and petroleum play in our society, and the destruction these processes do to the environment will remain a powerful debate for decades to me. An important question must be asked when looking towards the future however. Should we transition away from Petroleum and Natural gas for the sake of environmental health and if so, should we pursue nuclear energy, hydroelectric energy, wind energy, or look towards the creation and utilization of an entirely new energy source? The answer to this question will reflect many possible futures not just disclosing the fate of energy consumption, but also the attitudes and difficulties that will arise in regards to stemming production to save the planet.

This graph is very interesting! I am not surprised that petroleum has the highest energy consumption in the U.S. because people are relying on their own personal cars too much, instead of opting for public transportation or carpooling, even though they have acknowledged that is harmful to the environment.
I thought it was a different way of looking at this assignment! I really liked your graph because it had the ability to show all of the individual trends and differences. Although people are aware of how so many different variables contribute to harming the environment, it is sad to see hydroelectric cars are not as popular as I thought they would be.