High School Dropout Rates by Family Income 1972-2001

According to Radical Math, the graph below shows high school drop out rates of students aged 15 to 24 by family income from 1972-2001 for grades 10-12 in the United States. This study was produced by the United States Department of Commerce. Low Income is categorized as an income in the bottom 20% of all family incomes, middle income is categorized as a income between 20% and 80% of all family incomes, and a high income is categorized in the the top 20% of family incomes.

This graph shows that within families of lower income there are higher drop out rates compared to families with middle and low incomes. In 1972, the drop out rates among low income families was 14.1% while the drop out rate was 2.5% for high income families. In 2001, the drop out rate for low income families was 10% which decreased from 1972. In 2001, for high income families the drop out rate was 1.7%. According to this article by American Psychological Association (APA), the United States is currently in a drop out crisis. Their data in 2012 shows that 1.1 million students in the graduating class did not receive a high school diploma. Their reasoning for this is the adverse toxic stressors that are put on these students ultimately affecting their behavior and health. There is a need for solutions to improve the high school drop out rates.

Poverty Among Families in the U.S.

According to the U.S Census Bureau, of the 308,745,538 people living in the United States in 2010, 12.3% were living below the poverty line. The graph below shows the percent of people living under the poverty line among single family homes and married couple families with kids under the ages of 5 and 18. Overall, there is a greater percentage of families with a single mother living in poverty than families with married couples.


Among families with a female householder, 45% with kids under 5 years old and 39.7% with kids under 18 years old are below the poverty line. Among married couple families, 6.3% with kids under 5 years old and 7.9% with kids under 18 years old are living below the poverty line. The percent difference between each household type is very large, but I am not surprised that more single parent households are below the poverty line because they only have one income to support the family. Additionally, I imagine that there are more single mothers with kids under the age of 5 living below the poverty line because they need to financially support their family while also providing childcare for their young kids. There are fewer married couple families living below the poverty threshold because it is possible that there are 2 incomes that support the family.


Green gentrification in Brooklyn

Brooklyn is one of the five boroughs located in New York City and it is recognized as a global city, a green city, and a gentrifying city.  It is a global city because there are 2.5 million residents and one-third of its residents were born outside of the U.S.  Brooklyn has becoming self-consciously “green” in the twenty first century with a number of recent high-profile LEED certified buildings, new bike routes, and ambitious greenways are highlighted, as well as the high ratings local elected officials receive from environmental advocacy groups.  Kenneth A. Gould and Tammy L. Lewis, authors of “Green Gentrification: Urban Sustainability and the Struggle for Environmental Justice”, argue that this increased “greening” occurring in Brooklyn is leading to a jump in the city’s gentrification rate.  Much of the city’s growth is due to internal migration meaning Americans are flocking to Brooklyn and foreign immigrants are being forced out of the city they’ve lived in for decades.  “Green gentrification” is defined as the appropriation of the economic values of an environmental resource by one class from another (Gould & Lewis, 25).  This means that as environmental resources in Brooklyn become more available as amenities, that area of Brooklyn becomes more attractive to the wealthy, white in-migrants of the U.S.

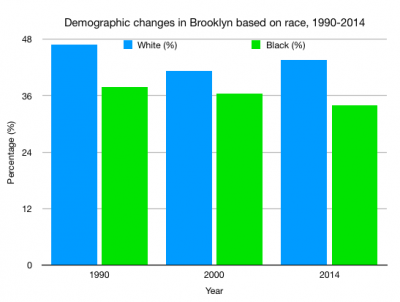
I took data provided in Gould & Lewis’s book that was focused on Brooklyn as a whole, as opposed to a single neighborhood, and graphed the increase of the white population compared to the decrease of the black population from 1990 to 2014.

As the graph shows, the green bar represents the black percentage in Brooklyn which has been gradually decreasing as the blue bar, which represents the white percentage in Brooklyn, has stayed steadily higher from 1990 to 2014.  Gould and Lewis argue that this is a result of green gentrification and environmental injustice in Brooklyn because wealthier, white residents are attracted to the quality of environmental amenities and push out low-income, black residents in the process.


Racial Disparities In US Prisons VS US Population

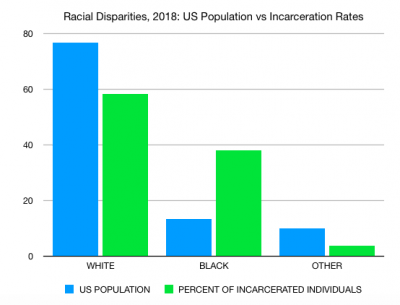
Did you know that only 13.4% of Americans are black? According to the United States Census Bureau, that leaves our population 76.6% white and only 10% Latino, Asian, and Native Americans combined. However, our incarceration rates do not reflect the same statistics. The Federal Bureau of Prisons released statistics last week that show 58.2% of US prisoners are white, 37.9% black, and only 3.9% other. I designed a graph to show just how skewed our justice system is.

As you can see, black imprisonment rates are higher in comparison to population percentage in the US than any other race. How is it that people of color are imprisoned at higher rates than white people, when whites represent 60% more of the population than blacks? This is an astonishing, though not surprising piece of information.

The mass incarceration of people of color has been an ongoing issue since the abolition of slavery. It would be naive to think this bias will go away anytime soon, as it will take generations to see any change. It is invigorating to know that people are so primitive in their ways of thinking about people that are different than themselves.

Are you a tree hugger?

Do you understand the value of a tree? Do you wonder about the welfare of a single tree? Forest? Do you think trees communicate and feel pain like humans can? Trees communicate with each other, by releasing chemical drifts, they can warn the trees around them if they are in danger. Well, lets take a step back and think about how important our forests and trees are.

In California alone, 129 million trees have died alone due to different variables of climate change since 2010. Trees are extremely generous; they provide nutrients for animals and other plant species in addition to help generate energy. But, with all of the extreme weather patterns: droughts, rainfall and fires trees have been struggling to survive. But, we are all aware of the benefits that trees and forests bring. They provide habitats for animals, they provide income for many resources in different industries, and they cultural recreation.

To put this in perspective, there is 1.7 million acres of forestland in Seattle. This land is worth “more in the total value than the annual revenue of Amazon.”

–>  with this perspective, it leads me to question why our president is trying to develop unprofitable coal plants? Developing coal plants on forest territory will not only destroy the habitats of many species and it takes away resources for other industries for their productions. Our president’s mission to create coal plants will cost consumers “hundreds of millions of dollars.” At the end of the day, is it worth it? Is it worth for unsubsidized industries that base their success based on the beauty of nature have to fight against the administration? Who wins?

–> Well trees are significantly important because they are extremely profitable and are crucial to help keeping us alive by providing us the necessary oxygen.

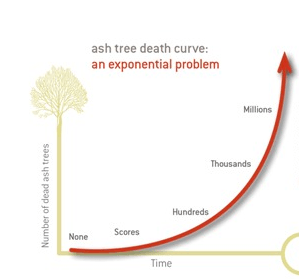
The graph below shows the significance and the rate in which trees are dying each year. This data only includes from the California, but if our President actually implements coal plants, the graph will spike dramatically. Also, one of the graphs shows the deforestation rates over the past decades. It shows a significant drop during the industrialization period throughout the 1900s.

What do you think? Do you agree with our president that we should develop and build coal plants? Or do you think we should try to preserve our forests?

Are you a tree hugger?

Negative Impacts of Gentrification in Brooklyn

The process of gentrification in urban areas can have a disastrous effect its inhabitants. The process refers to a physical, social, economic and cultural phenomenon whereby urban neighborhoods are converted into more affluent communities resulting in heightened property values and the discharge of low-income families. Gentrification happens not only all over the United States, but all over the world.  On my term abroad in Washington, DC this past spring, we witnessed gentrification in its prime—we saw nicer, new buildings being constructed in a poverty-ridden area.

Due to the construction of new buildings, the area becomes more expensive to live; rents rise, and therefore, impoverished people cannot afford to live there any longer.  They are forced to leave.  This process, gentrification, changes areas drastically over the course of several years.

The article I decided to analyze from RacialMath looks into gentrification of Brooklyn, New York.  The article, Who Hurts, by Ben Gibberd published in 2005, looks deeper into the personal problems of individuals being directly influenced by the gentrification in the area. Gibbered explains the new attractiveness of the area, and how it draws wealthy, middle-high income individuals to the area. From there, displacement occurs.

An interesting story from the article is of Ms. Anaya.  She resides in an overcrowded two-family home, living with her parents, brother and twelve other tenants.  The twelve other tenant include multiple children under three years old in just the upper-floor of the apartment alone. She explains the poor condition of the apartment, explaining that ”there’s a big hole in our bathroom, and hardly any heat.” And, her parents pay $1,000 a month in rent.

However, even though Ms. Anaya and her family want to move out—they cannot. Due to gentrification issues, they cannot afford a new place in Brooklyn.  She illuminates these problems by saying, “”Everything’s $725,000,’ and that’s on a bad block.”

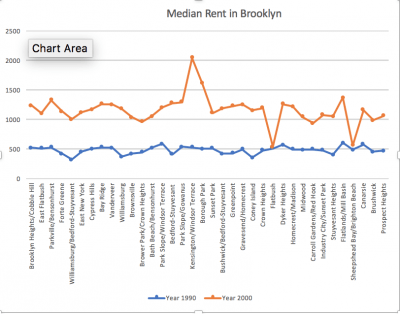
The issues raised in this article led me to another article posted on the RacialMath site. This article looks at the changes of rent from 1990 to 2000. I made a graph to show the increase in rent during the ten-year span.  Due to the large increase between these two years, we can only imagine how high the rent is today in Brooklyn, 18 years later.

AT&T and Sustainable Farming

AT&T Sustainability integration is a program, through AT&T, that connects sensor technology companies with farmers who are dealing with water management problems. The benefit to the farmers is that they make a profit while increasing their water/energy efficiency and simultaneously reducing their carbon footprint. The example the article uses is about a farm that produces rice.

Just as a point of reference, Rice is very prevalent and the production of rice covers about 1% of all land on earth. There are challenges growing rice. Specifically problems with irrigation because rice is grown on paddies or flooded fields. The problem with the flooding is that it creates methane (greenhouse gas). Methane, has “21-28 times as much warming potential as carbon dioxide”. So, if we can change the way we grow rice that will help. AT&T provides the connection to make water use more efficient and it allows farmers to use a method called “AWD” (Alternate Wetting and Drying) that reduces Methane creation and reduces the carbon footprint of rice farming. Hopefully, this type of technological advancement continues and helps farmers moving forward.

Sustainable Farming Article


Correlation Between Shooting Violence and Increased Temperature Graph

The article that I chose to bring to the blog site is something that I never expected to appear on the NY Times environmental page. It is showing a correlation between the weather and shootings in the United States based on the highest cities who have dealt with gun violence and murder. In addition to the interesting comparison that is created throughout this article, it is fascinating due to how many different types of graphs that are used to highlight the different statistics of this study. It begins with a type if line graph, moves to a bar graph and then finishes with a plot graph. After going over the decrease on gun violence that led up to 2014, it highlights the rise in gun violence ever since. One overall point that the article brings up is that the cities who are documented experienced an increase in shootings when the days were warmer than in the past when they were cooler. Is there a real connection between whether and shooting statistics one may ask? It does seem rather far-fetched with the increase in weapons and technology over the years that there is a correlation, however the article does analyze multiple aspects. With one exception, San Francisco, to the data provided, all of the cities increased in shooting rates during hotter temperatures. This is the overall thesis of the article.


The answer that is provided to this weird question is rather simple. The overwhelming answer is that due to warmer temperatures, people in the cities are more likely to be outside more often. Due to being outside there is a heightened issue between conflicts of people. They use Philadelphia as the most prominent example to show the answer to this problem. Author Asher use this city because it provides data for both inside and outside shooting data which covers both of the variables to this problem. And although it may be small difference when looking at one city, across the whole country it becomes a significant difference. One quote from the article articulates this issue very well, “On average, about twice as many people are shot in Northern cities like Chicago, Milwaukee and Detroit when it’s hot versus when it’s cold (only nonfatal shooting victim data was available for the latter two). In Southern cities like Atlanta and New Orleans, the effect exists but is weaker.”(Jeff Asher, NY Times)


This leads me question though, whether these two issues can be related or if this is a stretch. Are there aspects that have not been analyzed that add to this or is it as simple as the solution that they have provided? Although the data shows a rather simple correlation between the rise in temperature and rise in shooting I believe that there is more to this issue than just these two aspects. I am curious to see if others feel that the issue is this simple or more complicated. Further the issue of weather on human population sustainability. Many know the issues that have risen for animals but not for people such as this article investigates.


The graph below was the best and most descriptive from the three within the article:

https://www.nytimes.com/2018/09/21/upshot/a-rise-in-murder-lets-talk-about-the-weather.html?rref=collection%2Fsectioncollection%2Fclimate&action=click&contentCollection=climate&region=stream&module=stream_unit&version=latest&contentPlacement=7&pgtype=sectionfront


Introduction for Sustainability

Sustainability to me means successful problem solving in action. Since it can cover a variety of areas from economics to environmental conservation the problems that must be solved are endless. When someone fixes one of these issues for the better they are actively sustaining a better status for all and in the specific area. Growing up in a house hold with committed environmentalists has allowed me to see problem solving for sustainability first hand on numerous occasions. Some of the smallest examples seem to be direct fixes to the world’s largest of issues, like basic recycling or reducing your carbon footprint with better decision making on travel options. An issue that has always caught my attention with sustainability is that there seem to be a lot of people who think they are too little to make a change. That even if they recycled properly or carpooled to use less gas emissions that it would amount to a change worthwhile. It is one of the biggest issues I see with sustainability and seems to connect to many issues throughout the world today. I hope to explore the little things that are easy and will make a difference if we all just changed a habit or two for the better. Personally, I am a political science major who has taken classes and spent time in congress that have addressed actions taken to reverse and fix the effects of global warming. It has influenced me and my thoughts towards the environment directly driving me to enter this class and further my knowledge in the area.


I think that the article that you found is extremely interesting. That being said I would be curious to find a relatable article for your comments on CO2 levels and the corresponding physical damage to life on earth. I feel like many of us know that it is a major issue but do not understand what it directly is corresponding too. Possibly a good route for further investigation on this topic.


Your comments relating CO2 and photosynthesis needs for food and farming are extremely interesting. I wonder further however if there is a comparison between the photosynthesis CO2 produced and that of fossil fuels and artificial release. It could be a naive question but since it is a healthier production process is that different from the overall release of CO2 emissions.

World Energy Consumption

Image result for Energy consumption graph

One component of sustainability, focuses on the effect that occurs on the environment when harnessing fuel and energy. As the United States hit the Post Civil War Reconstruction Era, the use of coal supplanted a vast portion of the total energy usage done by the United States. Moving along the 20th century, the use of natural gas and petroleum has shot up exponentially. Curiously, following the invention of nuclear weapons and the creation of nuclear reactors, the energy usage as a percent of the total United States energy usage does not exceed 10%. This number surprised me, but I think it alludes to the extreme dependency and emphasis that the United States (as well as the rest of the world) places on petroleum and natural gas. As a result of our dependence, marginalizing and scaling down petroleum and natural gas extraction methods for the sake of environmental cleanliness will be met with steadfast opposition. Therefore, the dichotomy between the profits and ingrained role that natural gasses and petroleum play in our society, and the destruction these processes do to the environment will remain a powerful debate for decades to me. An important question must be asked when looking towards the future however. Should we transition away from Petroleum and Natural gas for the sake of environmental health and if so, should we pursue nuclear energy, hydroelectric energy, wind energy, or look towards the creation and utilization of an entirely new energy source? The answer to this question will reflect many possible futures not just disclosing the fate of energy consumption, but also the attitudes and difficulties that will arise in regards to stemming production to save the planet.