Agriculture and Climate Change

Agriculture has been the main means of survival for humans for centuries. The age of hunter-gatherers is ancient history. Societies all over the globe have been built and destroyed over the resources that are yielded due to the development of agriculture and agricultural technology. Because agriculture involves utilizing a small area relative to the number of crops grown or livestock raised on it, it means that farmers and ranchers are able to produce a high volume of what they are producing in a concentrated area. However, the world has been facing an agricultural crisis in the last millennium due to exponential population growth and a vast reduction in arable farmland. This means that the demand for milk, eggs, crops, meat, etc.. is rising, but the area in which these resources are produced is shrinking. The United Nations Department of Economic and Social affairs reported a projection that the world population will reach 9.7 billion people by the year 2050. But what does that mean for the future of agriculture? Well, modern scientists have already started to come up with solutions to these issues; many of which may sound familiar. Factory farming, genetically modified foods, pesticides and artificial growth hormone and antibiotic cocktails for animals are only a few ways that agriculture has been permeated by modern technology. Unfortunately, many of these technological ‘advances’ have been catastrophic for the earth. Factory farms produce incredible amounts of CO2 and CH4 and they pollute soil, ground water and air quality. The sick animals that they raise on artificial hormones and antibiotics are then fed to humans which makes us, by default, sicker as well. The plants, such as soybeans, produced by companies like Monsanto, are so altered and sprayed with chemicals that they are de facto stripped of their nutritional value.

In the same UN/DESA study, it is projected that the yield of staple grains like wheat and corn will decrease by 50% due to the effects of global warming. Imagine that: 35 years from now, we will probably have only half the number of grains and corn that we have now because of climate change. Less arable land means fewer farms, which leads to higher prices and lower production. Agriculture, and the deforestation that is needed to create farmland, is responsible for 1/5th or 21% of all CO2 emissions in the world, between 2000 and 2010. The total estimate of CO2 emissions from agriculture in this decade was approximately 44 billion metric tonnes. Anthropic climate change is killing agriculture, but the deforestation and greenhouse gas emissions from farms is one of the single largest causes of climate change in the world. So is agriculture good or bad? The simple answer is both or neither, whichever way you choose to look at it.

You can read the whole article here.

CO2 in the Netherlands

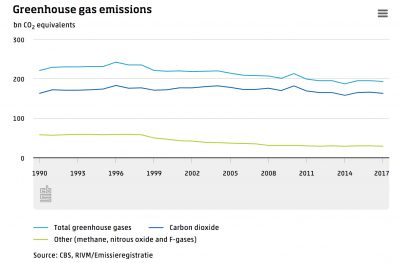
CO2 emission in the Netherlands was measured at 163 billion kilograms in 2017 which is the same as it was measured in the 1990s. But, methane, nitrous oxide and F-gasses all were measured at half the rate they were in the 1990’s. This may seem like a silver lining but the sectors causing the emission of CO2 has grown in scale, meaning the rate at which they emit CO2 has decreased. For example, Energy Companies in the Netherlands have produced more CO2 by 22 percent in this time period but they have increased production by more than 50 percent. Below is a table I found displaying the emissions of CO2 and greenhouse gasses since 1990.

1990-2017 Emissions


In my opinion the shift of the focus should not be just decreasing the rate of emissions but creating renewable energy that does not emit greenhouse gasses at all. CO2 is by far the most common product of industrial progression. But, it is important to note that no CO2 or greenhouse gasses are helpful to our atmosphere. Serious changes need to be made in the types of energy we use before the damage we cause is irreversible.


The Effects of Increasing levels of Carbon Dioxide

Kevin Loria’s article on the rise in Carbon Dioxide levels mentions that, for the first time in more than 800,000 years, the monthly average atmospheric carbon dioxide levels have topped 410 ppm. Providing a strong reason to believe this will have adverse effects on human health. This rise in CO2 levels will increase levels of pollution and the diseased related to it, as well as extreme weather patterns. These patterns would include heat waves, hurricanes, and spread the ranges of disease-carrying insects. Loria mentions that although the rise in Carbon Dioxide levels won’t have direct effects on our ability to breathe, but will “dramatically increase pollution and related diseases, potentially slow human cognition, cause extreme weather events (including deadly heat waves), and broaden the range of disease-carrying creatures like mosquitos and ticks.”

A study published in 2017 in the journal Nature Climate Change found that “30% of the world is already exposed to heat intense enough to kill twenty or more people each day.” This rise in atmospheric temperature may cause many more people to die every year and if temperatures continue to increase the numbers will multiply. This rise in temperature will also lead to a more intense hurricane season with rising water levels and warmer ocean temperatures. Along with extreme heatwaves, CO2 will destroy the ozone, which can lead to death through respiratory illness, asthma, and emphysema. Along with increasing rates of lung cancer, allergies, and cardiovascular disease. Insects along with their deadly diseases will spread to the warmer regions, who would typically die out during colder seasons would stay longer, and their habitats would expand further.

The effects of this rise in CO2 are already showing up, and without an answer, we will begin to see more and more severe consequences for our actions. The answers are more than just cutting back on CO2; this becomes a worldwide problem and not just a domestic issue.

The Wealth Gap & CO2 Emissions

In the “What if only 100 people existed on earth?” video, the narrator started to discuss how the distribution of wealth is not only not well dispersed, but highlights that the top 1% (with an annual income of over $1 million) of the global population owns 50% of the global wealth. This kind of spending power resting on the shoulders, or should I say the wallets, of such few individuals really peaked my interest.

On further research I found that there is an interesting mathematical correlation between a state/country’s state of income inequality and their “aggregate rate of emissions is an increasing function of of mean income and that any inequality-reducing redistribution of income will increase the aggregate rate of emissions” (655). This research actually discusses an equation that proves this point:

I found it very interesting that there is actually a Y variable in the above formula to represent an inequality constant that is used in calculating the average rate of emissions.

Irreversible Climate Change

In her article, “Irreversible climate change due to carbon dioxide emissions,” Susan Solomon and her colleagues express how the human race has such a large impact on the world’s climate change. The paper focuses on how the effects of increases in carbon dioxide on the atmosphere take around a thousand years to be repaired. Human activities were identified as the most prominent cause of the rise in “atmospheric concentrations of key greenhouse gases.” These increases in greenhouse gases, especially carbon dioxide, will result in a wider range of damaging and possibly irreversible climate changes.

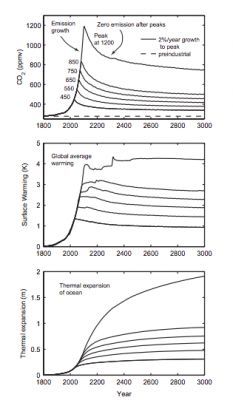
Solomon highlights how complicated the multi-step process of carbon dioxide atmospheric extraction can be. The process includes “rapid exchange with the land biosphere and the surface layer of the ocean through air-sea exchange.” Typically, 20% of the added tonnes of carbon dioxide stay in the atmosphere while 80% becomes mixed in with the ocean. Ocean warming is just one quantifiable aspect of climate change. Unlike methane or nitrous oxide, carbon dioxide is the only greenhouse gas whose gases persist over time rather than periodic instances. The graphs below display the amount of carbon dioxide that is “expected to be retained in the atmosphere by the end of the millennium.”

These three graphs display carbon dioxide and global mean climate system changes. Results are represented with an 11-yr running mean.

Overall, the main point of Solomon’s article was to highlight how irreversible these small but detrimental gas emissions can be to our climate. Changes in sea levels, changes in precipitation, and changes in atmospheric warming can all be traced back to the increase in CO2 emissions into the atmosphere. Not only are these changes dangerous to the environment, but also play a vital role in the timeline of mankind.

Connecting Cars and Carbon Dioxide

According to a 2016 study conducted by the U.S. Environmental Protection Agency (EPA), transportation accounts for 28% of total greenhouse gas emissions in the U.S.  The transportation economic sector includes the movement of people and goods by cars, trucks, trains, ships, airplanes, and other vehicles, however, the largest sources of transportation-related greenhouse gas emissions include passenger cars and light-duty trucks, including sport utility vehicles, pickup trucks, and minivans.  These sources account for over half of the emissions from the transportation sector. The remaining greenhouse gas emissions from the transportation sector come from other modes of transportation, including freight trucks, commercial aircraft, ships, boats, and trains, as well as pipelines and lubricants.  The majority of greenhouse gas emissions from transportation are carbon dioxide emissions resulting from the combustion of petroleum-based products, like gasoline, in internal combustion engines.

Based on 2014 data from an EPA study, U.S. greenhouse gas emissions totaled 6,870 million metric tons of carbon dioxide equivalents. This total represents a 7 percent increase since 1990 but a 7 percent decrease since 2005.  So how can we keep this number decreasing as it has been since 2005?  By implementing regulations and restrictions for fossil fuel consumption and combustion, but also by introducing alternative methods of transportation and best practice methods for transportation.  An example of a regulation is the EPA’s light-duty vehicle greenhouse gas rules, which are projected to save consumers $1.7 trillion at the pump by 2025, and eliminate 6 billion metric tons of greenhouse gas pollution. An example of a best practice method would be to reduce the travel demand by employing urban planning to reduce the number of miles that people drive each day and reducing the need for driving through travel efficiency measures such as commuter, biking, and pedestrian programs such as the EPA’s Smart Growth Program. As a country the U.S. can learn from practices other countries have implemented such as Germany, who is testing out a trial run of offering free public transportation in an effort to reduce greenhouse gas emission. The EPA on behalf of the U.S. is trying, but are we trying hard enough?

CO2 Levels are Rising

Carbon Dioxide (CO2) is a naturally occuring greenhouse gas that is a part of our atmosphere. The reliance on factories and various forms of transportation to burn fossil fuels have increased the amount of CO2 found in our atmosphere today. While, carbon dioxide only makes up 0.04% of the atmosphere this number has increased significantly overtime. Today CO2 levels consist of over 380 parts per million (ppm) but, prior to the Industrial Revolution carbon dioxide consisted of 270 ppm. Specifically, throughout this decade, CO2 levels have increased on average, 2.3ppm per year. Also, we emit 400 billion tons of carbon dioxide per year. In metric units this is 362.874 Tonnes. Again, this number simply shows that while CO2 makes up less than 1% of our atmosphere, the unnatural increase of CO2 has shown negative effects.

It is important that we find a way to reduce the amount of carbon dioxide in the atmosphere because it has serious effects on the environment such as making our oceans more acidic and increasing the temperature on earth.  A New York Times article discusses the fact that removing Carbon Dioxide from the atmosphere is a potential way to stop global warming. The goal would be to keep the carbon dioxide below the two degree Celsius target estimated in 2015 by the Paris Agreement. However, this is an extremely difficult task. One suggestion would be to follow a process known as “direct air capture” to minimize its presence. All of the studies show that it is extremely hard to decrease the amount of CO2 currently in the atmosphere but it is crucial that we take conscious steps to reduce it for the future sake of our environment.

Driving and Carbon Dioxide Emissions

Part-time, I work for Vintage Pizza in Latham, NY. My aunt and uncle own and operate the business, and when I can I help out and work. Occasionally, I’ll take deliveries to customers if need be. I like to deliver, because I like to drive my car and it gets me out of the kitchen where I normally work. But I’ve noticed, more so recently as I’ve begun to pay more attention to my carbon footprint, just how much I drive and emit when I deliver.

When I got my car, it had 25,000 miles on it. Today, it has about 80,000 miles. I average about 30 miles per gallon, and my car’s tank can hold 12 gallons. If I’ve driven 55,000 miles in my car, at 30 miles per gallon, I’ve used about 1,834 gallons of gas over that time.

When I plugged this number into the Environmental Protection Agency’s Greenhouse Gas Equivalencies Calculator, needless to say I was pretty surprised. My emissions equaled that of the average yearly energy consumption of 1.8 homes. It was the equivalent of using 37.7 barrels of oil.

Now, not every mile I drove my car was a result of delivering pizzas for my family’s business. I drove countless miles around town and to and from various places. But using the calculator really put things in perspective. For as much as I like to drive, I need to be more conscious about just how much I emit when I do.

The Dichotomy of Excess CO2

Upon reading a study conducted by Phillip Hunter of the U.S. National Library of Medicine, it became more clear that excess Carbon Dioxide represents an interesting paradox that will have to be dealt with by humanity eventually. On one hand, CO2 represents an integral process that is paramount for the future development of trees and most non-marine plants. On the other, it can be attributed too the extreme degradation of Coral life, as well as, the stemming and expulsion of grass. Correlating excess Carbon Dioxide to the loss of Coral life is possible because of CO2’s effect at changing, ” the pH of their environment, which will challenge their biochemistry—particularly organisms such as corals, coccolithophores (single-celled algae), crustaceans and molluscs, all of which use calcium carbonate (CaCO3) to produce external skeletons or shell coverings.” This is important to understand because these creatures have evolved to accommodate minimal light and nutrients on the sea floor. Combining the presence of large amounts of CO2 can irreparably change their fragile environment. And while their is an estimated 406.99 PPM (according to www.co2.earth), an estimated 75% of the Carbon Dioxide is sucked into the ocean. As humanity increases it’s CO2 output, the destruction of habitats for these creatures has the potential to become imminent.

While understanding CO2’s harmful effects on aquatic life, it can be considered a miracle grow for relatively all plants found on land. Accounting for approximately 96% of the mass of a plant during photosynthesis, the organic molecule of CO2 is the primary conductor that spreads the growth of plants. So much so that, “across a range of FACE experiments, with a variety of plant species, growth of plants at elevated CO2 concentrations of 475–600 ppm increases leaf photosynthetic rates by an average of 40% (Ainsworth & Rogers 2007). Carbon dioxide concentrations are also important in regulating the openness of stomata, pores through which plants exchange gasses.” How can this been seen as useful for humans? In gauging third world countries such as those find in Africa or Asia, the increased levels of CO2 in their atmosphere could act as the best possible fertilizer for most agriculture being grown. In addition, this increased output of plants represents an integral part of the many African and Asian towns and villages all over the world. This could be seen as a way out of poverty, with the increased promise of wealth coming from the stronger agricultural yield. So while, CO2 can be seen as having detrimental effects on one aspect of life, it can be viewed as an extremely prosperous and lucrative measure for many countries and people around the world.

Sources: https://www.ncbi.nlm.nih.gov/pmc/articles/PMC2267242/

https://www.nature.com/scitable/knowledge/library/effects-of-rising-atmospheric-concentrations-of-carbon-13254108

https://www.co2.earth/

Learning about Carbon Dioxide

An article published by the Environmental Protection Agency (EPA) discussed the effect greenhouse gases such as nitrous oxide, methane, and carbon dioxide, have had on radiative forcing on Earth. Energy from the sun is absorbed by Earth, and what is not absorbed radiates back into space, known as radiative forcing. Radiative forcing is responsible for rising temperatures on Earth, and rising temperatures are due to emissions of greenhouse gases that humans use for everyday activities. Carbon dioxide is the greenhouse gas that is primarily responsible for rising temperatures.


In the year 1990, the annual Greenhouse Gas Index ranked at a 1.0. In 2015, the Greenhouse Gas Index had increased by 37%, ranking at a 1.37. But what does this number, 37%, really mean for our planet, and how did this happen? First, in the United States, electricity generation, which occurs at power plants, accounts for 31% of greenhouse gas emissions since 1990, followed by transportation, which accounts for 26% of greenhouse gas emissions. Our economy accounts for a large percent of the greenhouse gases that are emitted each year. In the year 2010 alone, almost 46 billion metric tons of greenhouse gases were emitted in Earth’s atmosphere.

But what is 46 billion metric tons of greenhouse gas? According to the Union of Concerned Scientists, about 24 pounds of carbon dioxide are admitted for every gallon of gas used driving a car. 2,204 lbs is equal to 1 metric ton, so 46 billion metrics tons is equal to 101,413 billion pounds. 101,413 billion pounds is equal to 4,225.54 trillion gallons of gas. In other words, the emission of 46 billion metric tons of greenhouse gases can be explained in terms of the gas used to fuel cars each year, 4,225.54 trillion gallons of gas.