Print batch tuning results
See or export Startup tuning history
See or export one Startup tuning report
Print batch tuning results
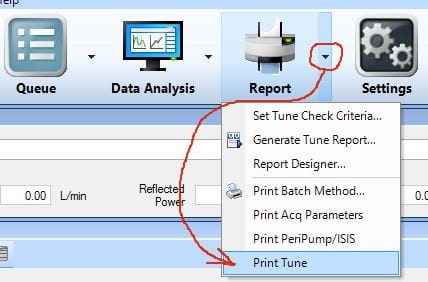
To print tuning settings for the open batch, click the down arrow on the Report icon, and select Print Tune. That prints out the basic tune settings: gas flows including cell gasses, torch position, lens and quadrupole voltages and frequencies, and detector voltages. It does not print any graphics.
What do the other things do? Generate Tune Report sends the autosampler to the tune solution and runs through the whole tuning routine. I don’t know if it actually prints anything in the end, or if it just adds another record to the tuning history (see below). Print Batch Method should be pretty obvious. Print Acquisition Parameters just prints a few settings from the open batch: Gas modes, elements, Q1 and Q2 masses, integration times, and detector modes. Print PeriPump/ISIS prints rinse bottle numbers, peripump rotation speeds, and times. Report Designer is a can of worms I am happy to remain ignorant of.
See or export Startup tuning history
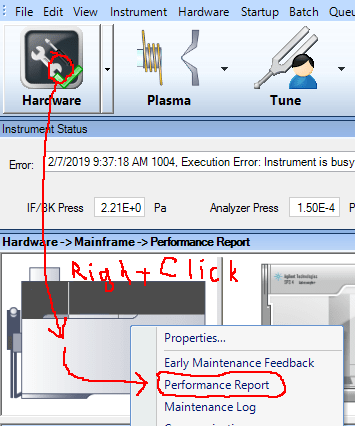
Press the Hardware button, right-click on the Mainframe icon, and pick Performance Report.
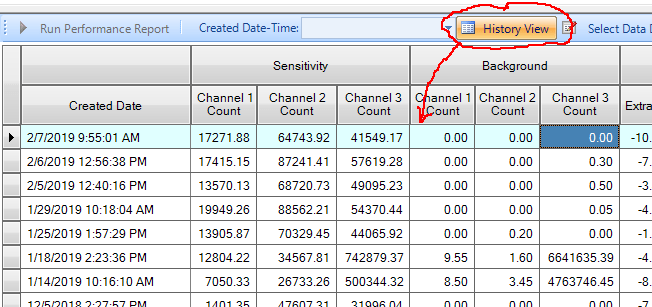
In the lower window, you get several possible views.
In History View, shown, you can see tuning results for each time the system performance report was done, usually the same time the start-up system tune was done. You can add or remove columns to show what you want.

Press the Select Data Displayed in History View button to, well, do just that. The new Add/Remove Columns window has a sub-menu that lets you change visible columns in four panels: Performance, HW Settings / Tune Parameters, Meters, and Other. Add or remove columns as indicated for each of the four panels. What you see is what you can export, so don’t skimp.
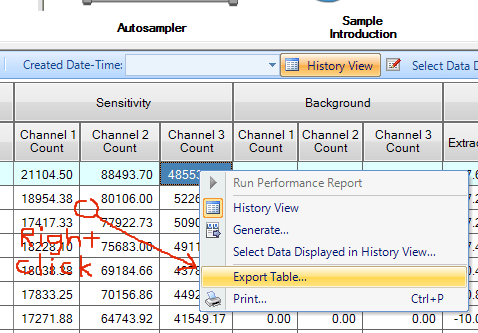
Right-click anywhere on a History View table and select Export Table. You will be prompted to select the name of the Excel-readable .CSV file, and the folder where you want it. This sort of thing is useful for seeing how different settings change over time.
See or export one Startup tuning report
Press the Hardware button, right-click on the Mainframe icon, and pick Performance Report.
In History View, shown, you can see tuning results for each time the system performance report was done, usually the same time the start-up system tune was done.
Double-click on the line you are interested in, to see graphics and other report details.

Report details are shown, separated into four tabs: Performance, HW Settings / Tune Parameters, Meters, and Other. Click through them to find what you want.

Right click anywhere on the report display and select Generate to save the whole report as a .PDF file. You will be prompted for where to save it. The file takes several minutes to prepare and to show up in your selected folder. Be patient.
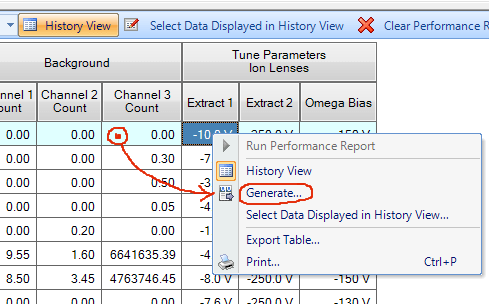
Alternatively, right-click on the History View row you want, and select Generate. You will be prompted for where to save it. The file takes several minutes to prepare and to show up in your selected folder. Be patient.
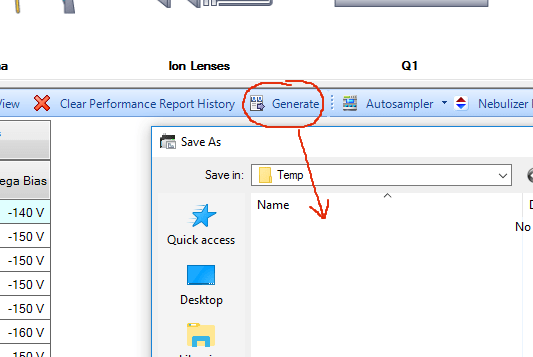
Alternatively again, with one report visible, or one report line highlighted, press the Generate button. You will be prompted for where to save it. The file takes several minutes to prepare and to show up in your selected folder. Be patient.