
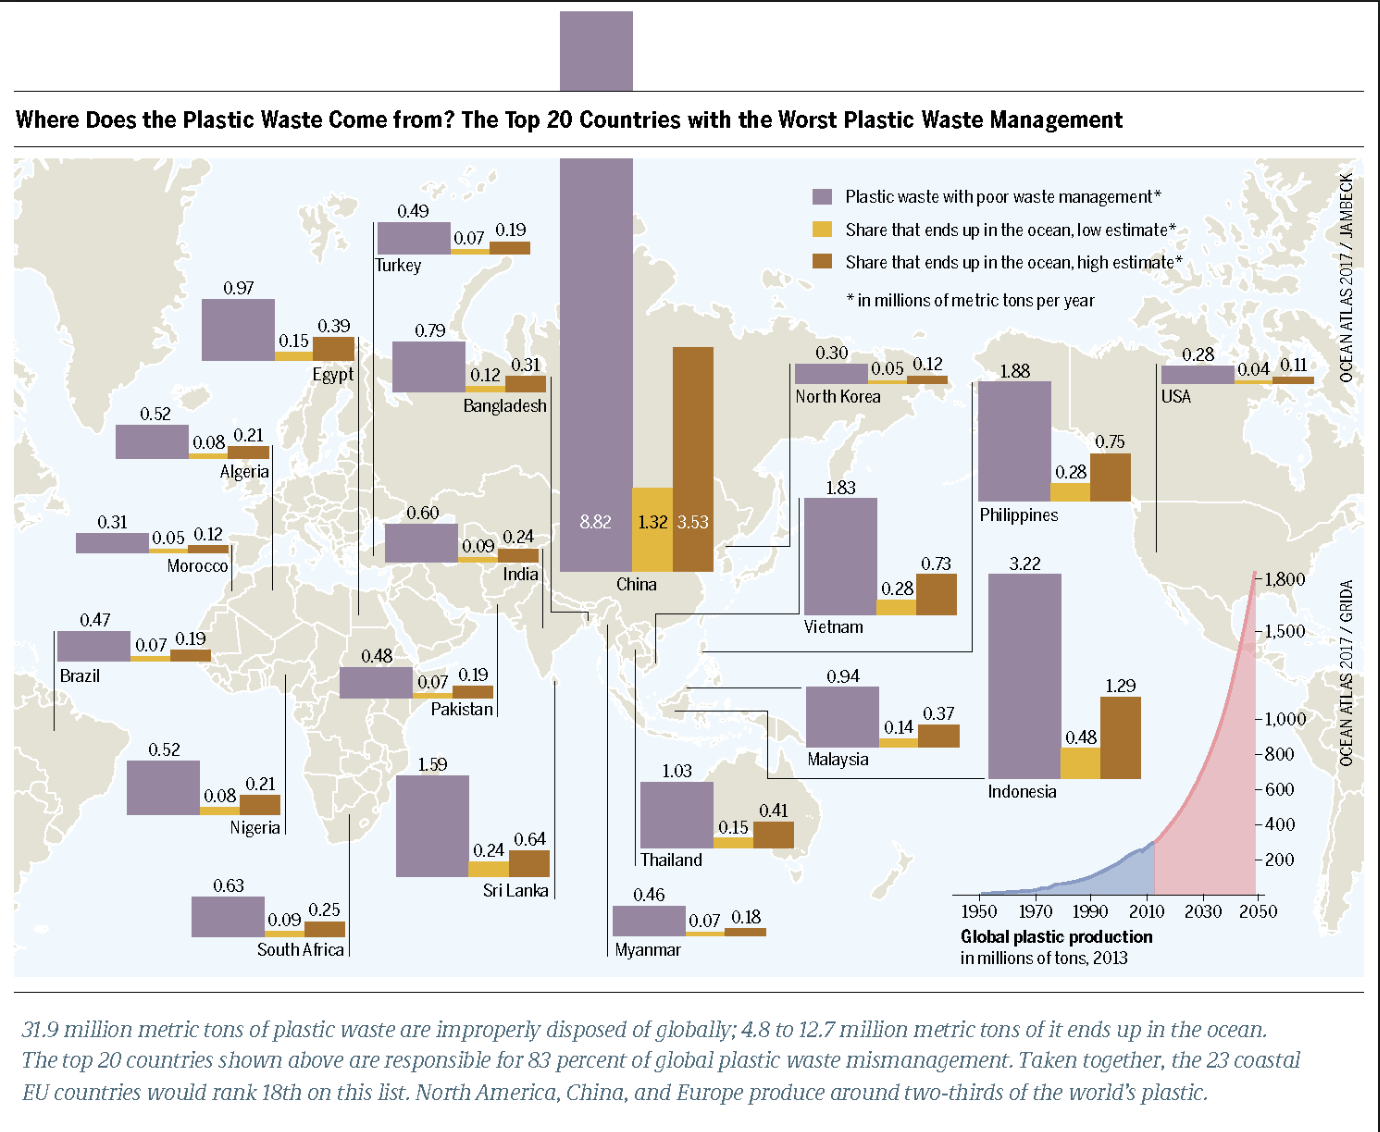
The graph above shows us the “The Top 20 Countries with the Worst Plastic Waste Management” in the world which are in order of most to least “plastic waste with poor waste management*”…
- China
- Indonesia
- The Philippines
- Vietnam
- Sri Lanka
- Thailand
- Egypt
- Malaysia
- Bangladesh
- South Africa
- India
- Algeria
- Nigeria
- Turkey
- Pakistan
- Brazil
- Myanmar
- Morocco
- North Korea
- USA
When this graph talks about how plastic waste in improperly managed the authors are referring to the millions of metric tons that end up in the ocean every year. This bar graph in particular recognizes that even though “North America, China, and Europe produce around two-thirds of the world’s plastic” it is not reflected in this graph because it is managed more “responsibly”.
Although, on further research I found that the United States is dependent on China’s plastic waste footprint economically as we import over 20% of our goods from China. It makes me question these graphs and how accurate they really are when we are so interconnected to one another in an age of hyper-globalization. It’s hard to know who to point the finger at when it comes to poor plastic management which is why it’s probably just best to look in the mirror.

You made a good point that we shouldn’t be pointing fingers at those who may be contributing to plastic waste since we all are responsible for this exponential crisis. Your analogy of ‘looking in the mirror’ seems to be a good way to look at it.
Since we do economically depend on China’s plastic waste, doesn’t that in turn make it our problem as well? We are at a point that it doesn’t matter who is to blame because we are all individually still practicing unsustainable habits, like using plastic on a daily basis.
The point you made about hyper-globalization is an important one. Just how is some of this data being measured and collected. If China is the world’s biggest emissions culprit, if they are responsible more than any other country on the planet, is that not in part because the U.S. relies so heavy upon China for goods and resources? I think data itself, and how that data is measured, should be taken with equal importance and relevance.
I really appreciate how you critiqued the graph and questioned its validity. Often, we take scientific data at face-value and trust it blindly. So, it really shows critical thinking in your skepticism. I also wonder, if the graph is representing reality, why these results might be. Maybe China has less regulation towards recycling or less education on the importance? It is also interesting because I would think that a more collectivist country like China would be more responsible with waste than a more individualistic country like the USA, though this is not what is shown here.
I was a bit surprised to see the U.S. ranked so low on this list. Countries whose economies are a fraction of ours have worse waste management. I share your skepticism of the graph as its does really seem to delve into several specifics. The U.S. undoubtedly produces more plastic waste than a country such as Sri Lanka, but what makes us do it “more responsibly” than them? The parameters for responsible waste management are not clearly defined by the authors of the graph.
doesn’t*