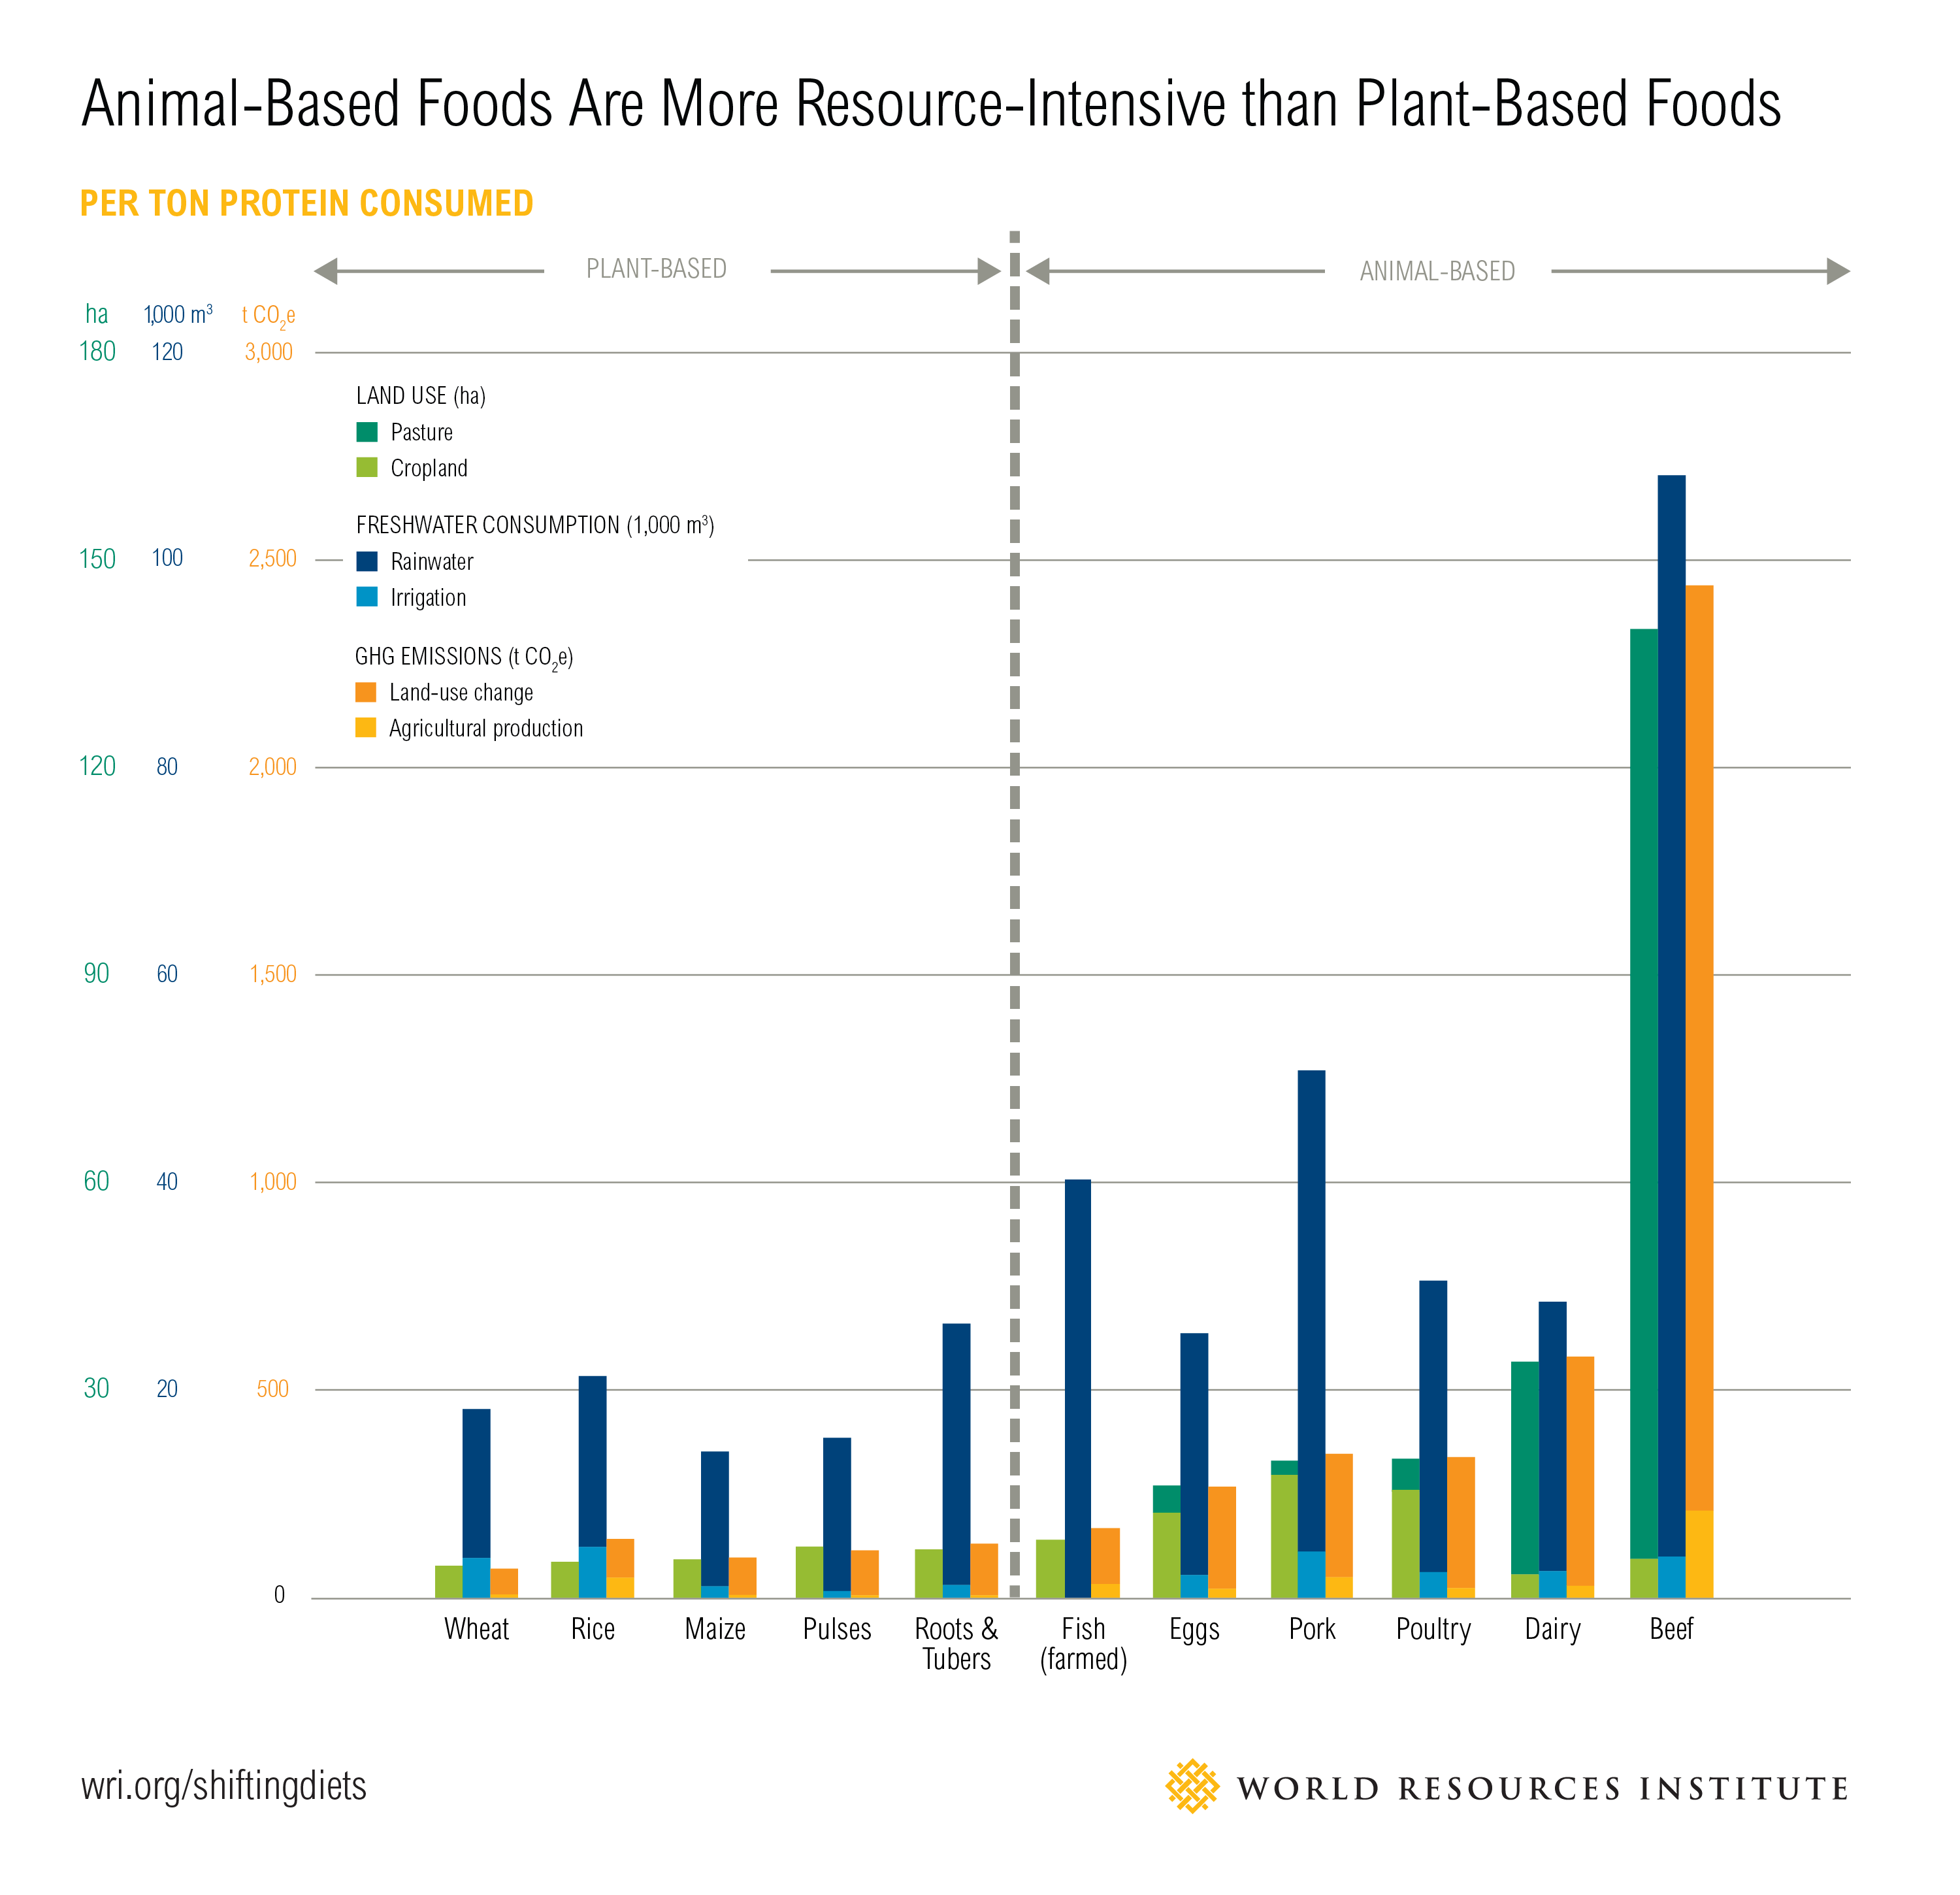
The production of animal based foods is an issue we have been discussing in class for the past few weeks and this chart helps break down consumption of meats and vegetables. The chart shows the required land, water consumption, and GHG Emissions for produces like wheat, rice, eggs, pork, and beef. The charts are higher when it comes to the consumption of meat as it takes more resource to cultivate. Producing animal-based foods is responsible for more than three-quarters agricultural land use around the world. The amount of land it takes to raise cattle is neisse compared to the land needed for agriculture. The resources that would be used on agriculture would not only be cheaper but have more benefit for everyone. Agriculture’s production-related greenhouse gas emissions is less compared to that of meat related consumption because of waste in resources. Because many animal-based foods rely on crops for feed, increased demand for animal-based foods widens the food gap relative to increased demand for plant-based foods.
2 thoughts on “Plant-Based Foods vs Animal-Based Foods”
Leave a Reply
You must be logged in to post a comment.


I made a blog post about a very similar topic. I think it really goes overlooked just how much the meat/dairy/egg industry has on the state of our planet. I find in my day-to-day experience that people are either completely ignorant to what they are buying into, or they are selectively educated — they just don’t wan’t to know. I think spreading awareness of just how bad the factory farm industry is for global climate change will help a lot.
I found your graph very compelling. We have discussed many times how harmful the beef industry is for the environment, but displaying it on this bar graph is a good way of showing the discrepancy between how much resources beef uses compared to other products.